2022 Study: This Is the Most Expensive Year in History To Move

In May 2022, U.S. inflation hit a 40-year high of 8.6%, sending shockwaves through the economy. For anyone relocating, the impact was immediate and historic. Driven by skyrocketing gas prices, pricier trucks, and higher labor costs, the average cost of a move jumped 15% year-over-year. HireAHelper data reveals how these compounding pressures officially made 2022 the most expensive year in history to move.

Key Takeaways
- So far in 2022, moving costs are 9% higher than in the same period in 2021
- In May 2022, the average cost of a move was $427 — 15% higher than in May 2021
- Moving was at its absolute cheapest during the height of the pandemic (2020; $320 on average)
- The average cost of a move is set to reach a high of $454 by August 2022, coinciding with peak demand for moving services
- Moving in 2022 is more expensive in 39 out of the 45 states in which data is available, with Maine seeing a 51% YoY spike
- The rise in the cost of moving affects 90 out of 108 cities, most notably Columbia, SC (+42%) and Seattle, WA (+39%)
Volodymyr Kupriyanov
Volodymyr Kupriyanov (AKA "VK") is a data journalist based in Copenhagen, Denmark. He specializes in data-driven storytelling, leveraging data to create compelling, insightful stories. His stories for HireAHelper have been featured in hundreds of publications, including Business Insider, The New York Times, and Bloomberg. When not visualizing and analyzing numbers, he enjoys rock climbing, playing frisbee with his dog, and discovering new places to eat.
Up Since the Pandemic: How the Cost of Moving Changed Over Time
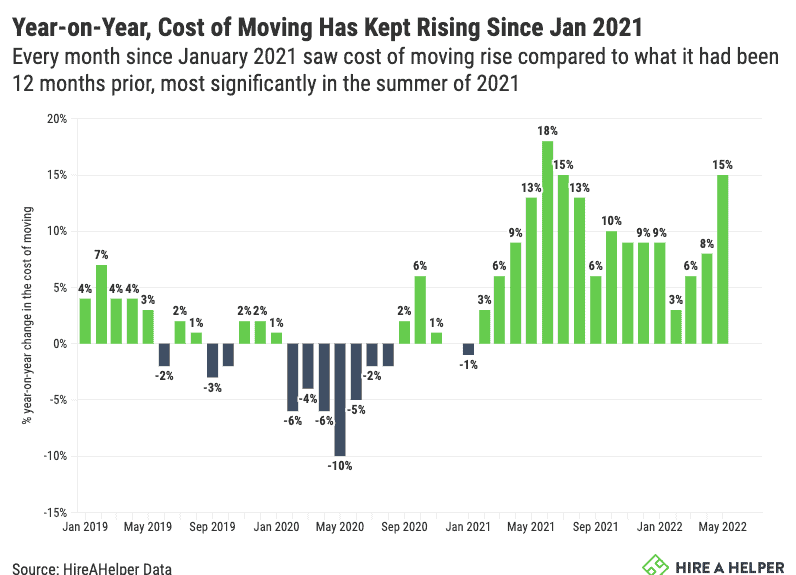
From 2018 to early 2021, the change in the cost of moving was relatively flat; rates would go up only 4% one month, then down 3% the next month.
Then, the global pandemic happened. This forced many to put their moving plans on hold, resulting in the cost of moving services declining for four months straight (February-May 2020). In May that year, the cost of a move on average was $320 — 10% cheaper than the year before and the cheapest it’s been in the last five years.
As the pandemic eased and vaccinations picked up in 2021, moving activity resumed its typical levels and prices bounced back. During this period, moving costs were up by an average of 15% year-over-year. By August 2021, the cost of moving crossed the $400-mark, averaging $407 per move.
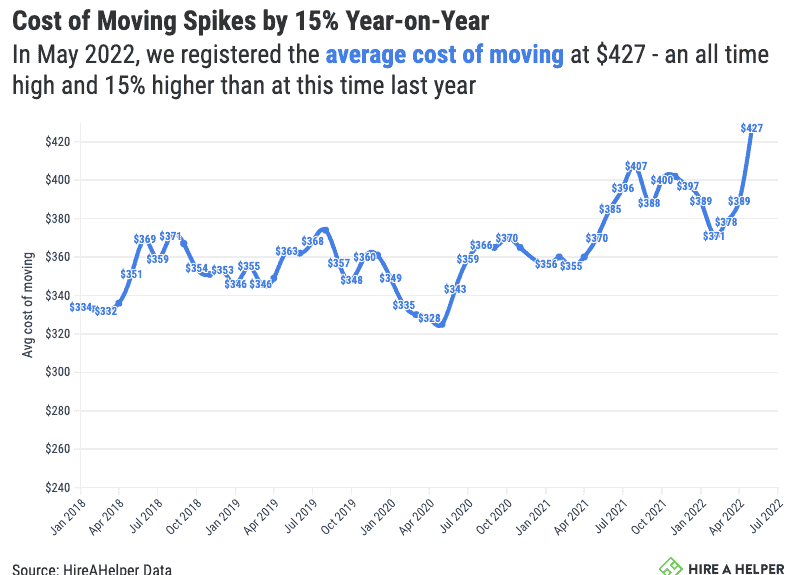
Since then, the cost of moving ebbed and flowed before reaching an astounding $427 in May of 2022. Way ahead of the inflation rate, the cost of moving is 15% higher than it was this time last year, and 10% higher than just a month ago.
In fact, since January 2021, the cost of moving has only gone up year-on-year. In other words, there hasn’t been a single month in that period where the cost of moving wasn’t higher than it had been 12 months prior.
All Over The Place: Where Cost of Moving Soared Highest
Now that we know moving is becoming more expensive nationally, let’s have a look at how the cost of moving has changed in different parts of the country.
Which states are seeing the greatest jumps in moving prices? In which cities are the moving costs spiking? Are there any states and cities that buck the overall trend?
Based on our figures, those moving in Maine are experiencing the biggest year-over-year spike in cost. The average so far this year is $525, which is some 51% higher than the $350 cost of an average move in the first five months of 2021.
Overall, so far there are five states where moving in 2022 costs a whopping 25% higher or more than during the same period last year. Besides Maine, these states are Nebraska (+30%), Utah (+28%), Alabama (+27%), Idaho (+27%), and Delaware (+26%).
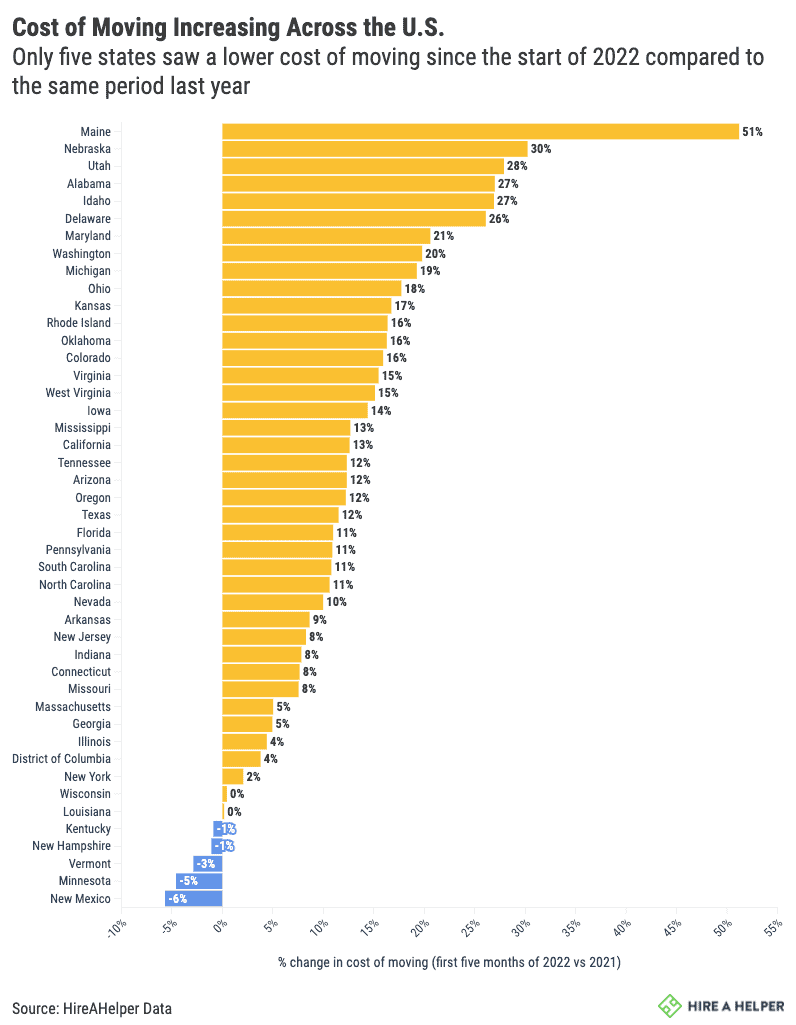
There were also five states where the cost of moving remained the same or decreased compared to May 2021. It should be pointed out that the percent decrease was quite marginal in all cases, and only reached a maximum of -6% in New Mexico and -5% in Minnesota.
Cities followed a similar pattern to states. In 90 out of 108 cities for which there are representative data, we saw a significant increase in how much moving costs in May 2022 compared to in May 2021.
For the majority of cities, the price spike was between 10% and 25%. On the highest end, Columbia, SC (+42%) and Seattle, WA (+39%) saw an increase in moving costs of around 40% during the first five months of 2022, as compared to 2021.
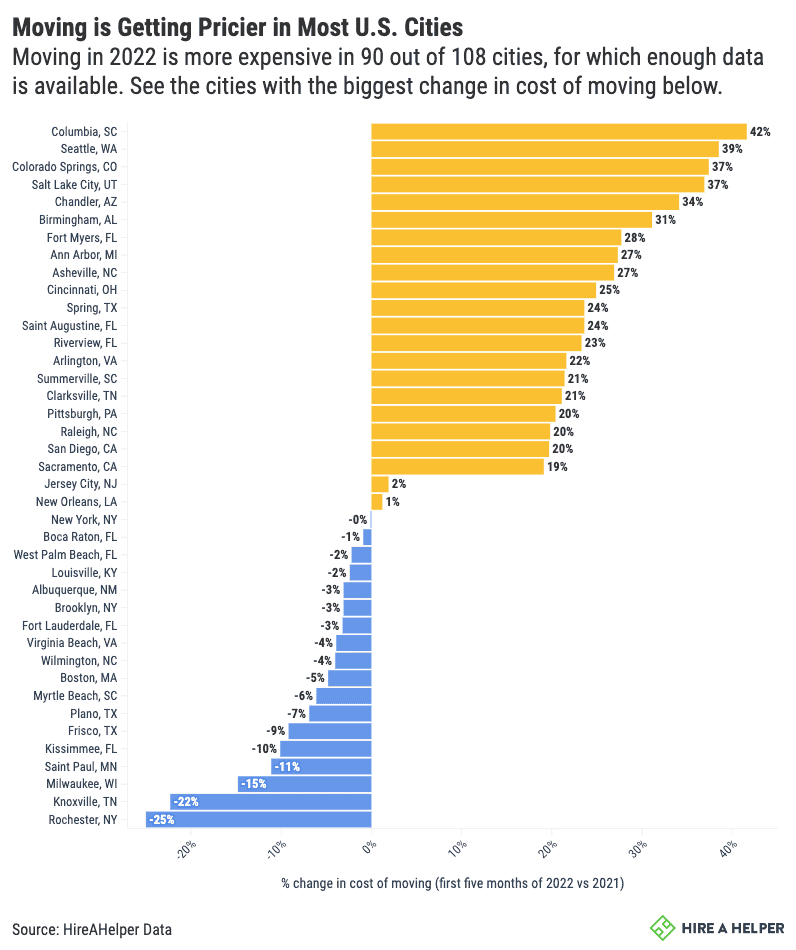
Top among those few cities where moving costs didn’t spike are Rochester, NY (-25%), Knoxville, TN (-22%) and Milwaukee, WI (-15%). Curiously, the cost of moving in New York City stayed the same in 2022 as it was the year before.
High Season: Summer Signals Even Higher Moving Costs
As if it wasn’t high enough already, the cost of moving is likely to rise even more this summer. Partially, this is due to inflation, but to a greater extent, this is also due to the laws of supply and demand.
Peak moving season, i.e., the time of the year when Americans are most likely to move, is routinely observed from June through August. Roughly 40% of all moves that happen during any given year take place during the summer months, meaning that’s when the demand for moving services is the highest.
This demand is reflected in the increased cost of moving during the summer. Based on our data going back to 2018, moving costs tend to peak in August. (The only exception was 2020 when, for reasons noted above, moving season shifted to autumn and the cost of moving was highest in October.)
What does this mean for 2022? Most likely, despite the already higher costs, moving is likely to get even more expensive as we get into the summer and the height of the moving season.
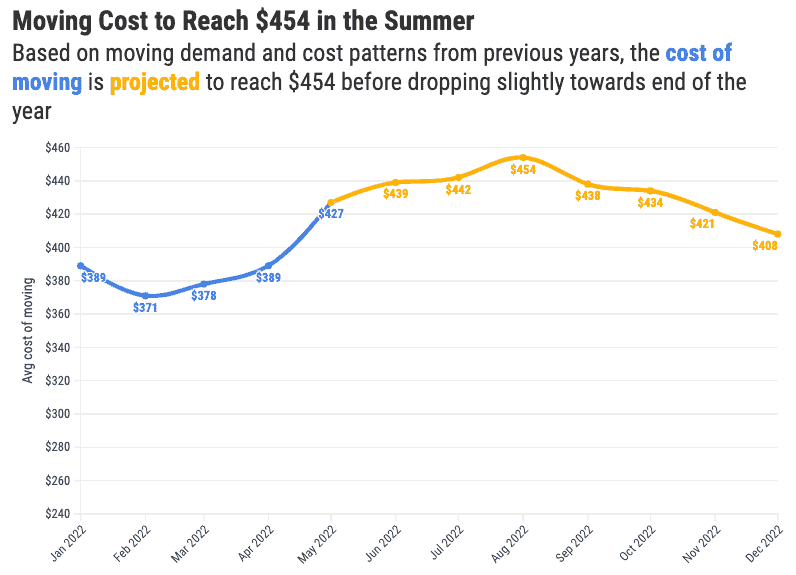
Assuming 2022 will look like non-pandemic years in terms of when and how many people move, our forecast suggests that the average cost of a move will reach a record-high of $454 per move by August.
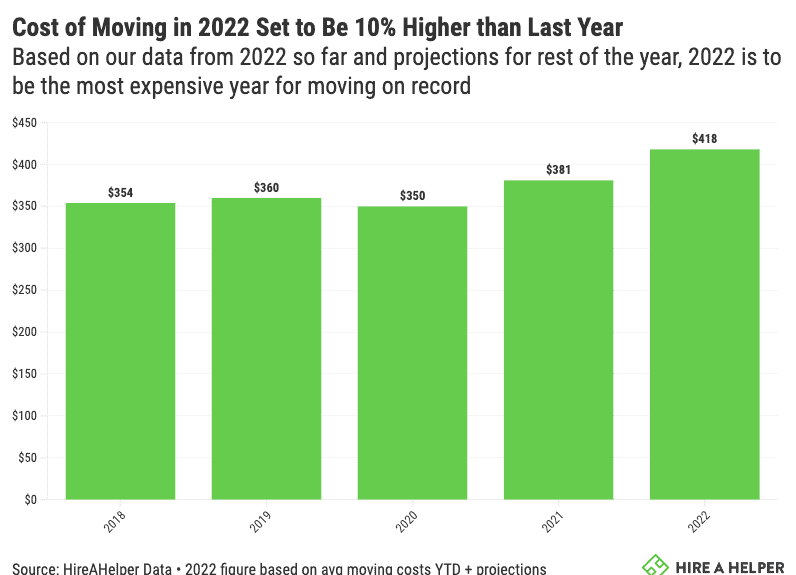
This would make 2022 the most expensive summer for moving in the U.S. by far. Even though the average cost is likely to return to the $400-mark by year’s end, 2022 is projected to be the most expensive year for moving on record.
There’s not much we can do about inflation and rising gas prices, but you can still fight back against rising prices!
First, have a look at our guide to help figure out how much money you should spend on a move. Looking to rent a U-Haul? Check our tips on how to save on your truck rental.
And if you are planning to move this summer, be sure to read our advice on how to save money on moving during peak moving season.
Sources and Methodology
All charts and tables are based on the analysis of 233,000 local moves in the U.S. booked through HireAHelper.com and our partners from January 2018 through May 2022.
States and cities with less than 100 moves in the last 12 months were excluded from the state-by-state and city-by-city analysis, respectively. However, calculations of the cost of moving by month of the year or day of the week do include data from all states and cities.
Illustrations by Elizabeth Gu
Latest Research

The HireAHelper National Migration Report
Each year, HireAHelper analyzes where Americans are moving, why they’re leaving one place for another, and what that says about the economy, housing, and everyday life. The National Migration Report is our flagship study of U.S. relocation patterns, giving journalists, researchers, and industry professionals a consistent, year-over-year look at how America moves.

2025 Charlotte Moving Report
If it feels like everyone’s moving to Charlotte these days, you’re not imagining it! The Queen City is one of the fastest-growing places in North Carolina and the entire Southeast. According to our 2025 North Carolina Migration Report, 147 people move to Charlotte every day, part of a larger trend that has made North Carolina a top-five destination for movers nationwide. It’s drawing talent from across the state and beyond, reshaping how North Carolina grows and cementing its role as one of the country’s most dynamic cities.
We created this report to show what’s fueling that growth, who’s coming here, and what it means for people who already call Charlotte home.

The Future of Homeownership 2026
In 2026, the American Dream is facing a reality check. The median U.S. home price has climbed to $390,300 and is projected to reach $527,525 by 2031 - a 35.1% increase in just five years. But incomes aren't keeping up, despite growing minimum wages. Across the country, the gap between what people earn and what it takes to buy a home is widening fast, pushing homeownership further out of reach for millions of Americans.
This is a nationwide affordability crisis with sharp regional divides. In some states, buying a home still aligns with what the average household earns. In others, even an income of $100,000 falls short.
Using median home prices, household incomes, and five-year projections, this report reveals where Americans can still afford to buy today, where affordability is deteriorating fastest, and which markets may become realistic, or completely out of reach, by 2031.

2023 Study: 3 Million Moves Driven by Extreme Weather Events Last Year
In this study, HireAHelper takes a close look at moves forced by natural disasters in the United States.
Using the most recent data from the Census Bureau’s large-scale Household Pulse Survey and Current Population Survey, we focused on the number of disaster-forced moves over time, their typical destinations, as well as the types of disasters forcing most Americans out of their homes.

Study: How Much Does Moving Cost in 2023?
Driven by record inflation and rising fuel and vehicle costs, U.S. moving costs reached an all-time high in 2022. The average cost that year was $410—peaking at $454 in August—representing a 7% increase from 2021.
Prices have not yet given way; data from the first five months of 2023 shows an average moving cost of $399, which is 4% higher than the same period last year. It remains uncertain whether these costs will stay elevated or decline, which states will experience the sharpest price hikes, and if any areas will become cheaper.

2023 Study: Corporate Relocation at Highest Rate Since 2017
Whether to cut costs, gain a more beneficial tax rate, or be closer to a target market, about 9% of corporations in the United States moved their headquarters within the past fiscal year — the highest percentage since 2016-17, according to Securities and Exchange Commission (SEC) filings.
States like New York and cities like Seattle are seeing corporate headquarters move away, while smaller cities outside large urban centers are becoming new homes to big companies in tech and pharmaceuticals. Our study breaks down where companies are moving to, which states and cities they’re leaving behind, and whether workers are on board with following their employer to their new HQ location.