For Richer and For Poorer: How Moving Patterns of Americans Differ by Income Level

The economic divide in America fundamentally alters how, where, and why people relocate. While moving is often viewed through the lens of a fresh start, a deep dive into domestic migration reveals that income heavily dictates mobility. High earners move less frequently but cross greater distances, often motivated by job transfers or purchasing a home. Conversely, lower-income Americans move at much higher rates but typically stay local, driven primarily by rising costs and the search for cheaper housing. This report explores these oppositional migration patterns, highlighting the distinct states and cities gaining and losing residents across different economic classes.

Key Takeaways
- America’s bottom 20% of earners are 32% more likely to move than their top-earning counterparts, according to Census data for 2023
- The top 20% of earners were more likely to move to a different state than Americans in other income brackets
- Moving “to own a home” was nearly five times more common among the top 20% of earners (11.6% of moves) than among the bottom 20% of earners (2.5% of moves)
- Vermont is the top destination for the top 20% of earners (net gain of 89%)
- Oklahoma saw twice as many low-income Americans move in (net gain of 102%) than out in 2023, more than any other state
Volodymyr Kupriyanov
Volodymyr Kupriyanov (AKA "VK") is a data journalist based in Copenhagen, Denmark. He specializes in data-driven storytelling, leveraging data to create compelling, insightful stories. His stories for HireAHelper have been featured in hundreds of publications, including Business Insider, The New York Times, and Bloomberg. When not visualizing and analyzing numbers, he enjoys rock climbing, playing frisbee with his dog, and discovering new places to eat.
Taxes, Housing, and Gentrification: The Economic Effects of Moving
When people move, their income moves with them. This can affect local economies, both in the places they move to and in the places they leave behind. High-income individuals moving to “cheap” cities or states have gentrification effects, observed in places like Seattle, WA, Portland, OR, and the much-publicized movement of high-earning Californians to Texas that has made housing less affordable in the Lone Star State. In turn, California and New York have lost $90 billion in income tax revenues due to out-migration, according to the most recent IRS data.
Moves of the bottom 20% of earners can also have profound economic consequences. Being continually priced out of buying a home or struggling to keep up with the cost of living, Americans on lower incomes flock to areas they can afford, resulting in poverty concentration. This is a phenomenon whereby certain cities or suburban areas become “predominantly poor”.
According to the HUD report, poverty concentration results in communities having serious issues with crime, health, and education, which affects both the current living standards and the future social and economic prospects of their residents. In this study, we examine moving patterns of Americans by income level and explore how much, why, and where Americans on the opposite ends of the income scale move.
Low Earners Move More, High Earners Move Farther
The top 20% of American households by income (those earning $150,000+ per year) are much less likely to move than their relatively poorer counterparts. In the past year, the higher earners moved at a rate of only 6.5%, in contrast to the 9% moving rate of those in the bottom 20% of households by income (those earning less than $30,000).
The most likely explanation for this is homeownership. Our moving studies and statistics show that renters are two to three times more likely to move than those who own a home outright. Americans with high incomes are much more likely to be homeowners and, by extension, significantly less likely to move.
As for the middle-earners who make up 60% of U.S. households, they are closer to the bottom earners in their overall mobility rate (9%), but similar to top earners in that almost one in five (18%) of those who did move in 2023 crossed state lines.
Better Housing vs Cheaper Housing: Motivations Behind Moves of Americans by Income Level
For the top 20% of American earners, home ownership is both a reason to stay and a reason to move. Becoming a homeowner (or “Wanted to own home, not rent” as the Census Bureau puts it) was the #3 reason for moves of those in the top income quintile with around 12% of Americans in this income bracket moving for this reason last year.
By contrast, only 2.5% of those in the bottom 20% of earners moved because they bought a home in 2023. The top 20% of earners were also much more likely to move for new and better housing (18%) and new jobs (12%). The poorest 20% of households only accounted for around 10% and 7% of those types of moves, respectively.
Conversely, the poorest 20% of U.S. households were significantly more likely to move for cheaper housing (12%, compared to 6% among the top earners), health reasons (3% vs 1%), and other family reasons (10% vs 7%). "Other family reasons", according to the Census Bureau, most often refers to moving closer to or with family to take care of them or share in childcare duties. The middle 60% of households in the U.S. were, predictably, between the two extremes regarding motivations behind moving. Around 7% of those who moved in this bracket did so because they bought a home, and 10% moved for cheaper housing.
Almost 9% moved for family reasons, and a similar share moved for a new job or transfer. But where do Americans of different income levels actually move? The next section explores the states gaining or losing residents in different income brackets.
Top Earners Vie for Vermont, Low Earners Opt for Oklahoma: Interstate Moves by Income Bracket
Driven by different motivations, which states are people on different sides of the income scale most likely to flock to? And which states are they leaving behind? Based on the 2023 data from the Current Population Survey, Vermont was the state that gained the most of the top 20% of earners in America. As many as 89% more top earners moved here than left the state last year. Other states where more high-earning Americans were moving to (rather than out of) include West Virginia (+69%), Connecticut (+65%), and Iowa (+58%).
The list of states with the highest gains among the bottom 20% of earners looks rather different. Oklahoma (+102%) was at the top with twice as many low-income households moving into the state than leaving it. Iowa made another appearance in this bracket, with a net of 53% more low earners relocating here.
Arizona (+45%), Texas (+43%), and Kansas (+43%) rounded out the top five. And what about the middle class? For them, the top five states by net move gains were Delaware (+55%), South Carolina (+53%), Florida (+52%), Maine (+49%), and Georgia (+43%).
On the other side of the spectrum, the bottom 20% of earners were more likely to leave California (-57%), New Jersey (-45%), and New York (-44%) than move to these states. The top earners left Illinois (-57%), Nebraska (-47%), and Maryland (-37%) the most, while the middle 60% vacated New York (-55%), California (-45%), and Maryland (-28%) at the highest rate. Interestingly, Idaho and Washington saw a significant increase in the amount of top-earning Americans moving there, while simultaneously losing more low-income households.
Kansas, New Mexico, and Nebraska show the reverse trend. These states saw a significant outflow of the top 20% of households by income while posting significant net gains in the bottom 20% of earners. As for the middle 60% of U.S. earners, they're closer to their poorer counterparts than to the richer households when it comes to interstate moves.
High- and Middle-Income Americans Flock to Central Florida: Income-Based Moves by Metro
At a more local level, certain metropolitan areas are disproportionately popular among people in different income brackets. For the top 20% of earners, the Deltona, FL (+171%) and College Station, TX (+132%) metros saw the highest net gain of movers out of all cities.
Among the bottom 20% of earners, the metros posting the greatest net gains were Greensboro, NC (+80%), Fort Collins, CO (+67%), and Oklahoma City, OK (+51%). Finally, Port St. Lucie, FL (+88%), Deltona, FL (+79%), and Cape Coral, FL (+64%) were the metro areas with the most favorable ratio of incoming to outgoing residents in the middle 60% of earners. See which metros were most popular with Americans of different incomes on the map below.
Metropolitan areas where top earners were most likely to leave in 2023 were Omaha, NE (-84%), Louisville, KY (-75%), and Bakersfield, CA (-72%), while the low-earning households decided Boise, ID (-80%), Omaha, NE (-78%), and Baton Rouge, LA (-74%) were no longer for them.
As for the middle 60% of earners, the areas posting the highest percentage net losses in 2023 are Springfield, MA (-75%), Fayetteville, NC (-66%), and Buffalo, NY (-62%). The latter is tied with the New York, NY metro area, where 62% more middle-income Americans have moved out than they moved in last year.
For even more info on where people in different income brackets are moving, check out the tables below!
State Tables
Top 20% of Earners: States by Net Moves
| Top 10 | Gain % | Bottom 10 | Loss % | |
| Vermont | 89% | Illinois | -57% | |
| West Virginia | 69% | Nebraska | -47% | |
| Connecticut | 65% | Maryland | -37% | |
| Iowa | 58% | New Jersey | -37% | |
| Florida | 57% | Louisiana | -37% | |
| Alabama | 54% | Minnesota | -32% | |
| North Carolina | 46% | New York | -25% | |
| South Carolina | 43% | Maine | -24% | |
| Indiana | 42% | California | -21% | |
| New Hampshire | 37% | New Mexico | -18% |
Bottom 20% of Earners: States by Net Moves
| Top 10 | Gain % | Bottom 10 | Loss % | |
| Oklahoma | 102% | California | -57% | |
| Connecticut | 61% | New Jersey | -45% | |
| Iowa | 53% | New York | -44% | |
| Arizona | 45% | Vermont | -38% | |
| Texas | 43% | Utah | -29% | |
| Kansas | 43% | Wisconsin | -26% | |
| Kentucky | 40% | Maryland | -25% | |
| Florida | 39% | District of Columbia | -23% | |
| New Mexico | 39% | Hawaii | -21% | |
| Rhode Island | 36% | Massachusetts | -18% |
Middle 60% of Earners: States by Net Moves
| Top 10 | Gain % | Bottom 10 | Loss % | |
| Connecticut | 96% | New York | -55% | |
| Delaware | 55% | California | -45% | |
| South Carolina | 53% | Hawaii | -28% | |
| Florida | 52% | Maryland | -27% | |
| Maine | 49% | Louisiana | -27% | |
| Montana | 49% | New Jersey | -27% | |
| Kansas | 44% | Iowa | -27% | |
| Georgia | 43% | Illinois | -27% | |
| Arizona | 39% | Utah | -26% | |
| New Mexico | 39% | District of Columbia | -25% |
Metro Area Tables
Top 20% of Earners: Metros by Net Moves
| Top 10 | Gain % | Bottom 10 | Loss % | |
| Deltona-Daytona Beach-Ormond Beach, FL | 171% | Omaha-Council Bluffs, NE-IA | -84% | |
| College Station-Bryan, TX | 132% | Louisville/Jefferson County, KY-IN | -75% | |
| Santa Maria-Santa Barbara, CA | 127% | Bakersfield, CA | -72% | |
| North Port-Sarasota-Bradenton, FL | 68% | Ogden-Clearfield, UT | -71% | |
| Ann Arbor, MI | 63% | New Orleans-Metairie, LA | -69% | |
| Provo-Orem, UT | 40% | Chicago-Naperville-Elgin, IL-IN-WI | -68% | |
| Akron, OH | 35% | Minneapolis-St. Paul-Bloomington, MN-WI | -65% | |
| Austin-Round Rock, TX | 34% | Denver-Aurora-Lakewood, CO | -63% | |
| Knoxville, TN | 33% | Tulsa, OK | -63% | |
| Fresno, CA | 32% | Detroit-Warren-Dearborn, MI | -57% |
Bottom 20% of Earners: Metros by Net Moves
| Top 10 | Gain % | Bottom 10 | Loss % | |
| Greensboro-High Point, NC | 80% | Boise City, ID | -80% | |
| Fort Collins, CO | 67% | Omaha-Council Bluffs, NE-IA | -78% | |
| Oklahoma City, OK | 51% | Baton Rouge, LA | -74% | |
| Pensacola-Ferry Pass-Brent, FL | 24% | Denver-Aurora-Lakewood, CO | -72% | |
| Charleston-North Charleston, SC | 20% | New York-Newark-Jersey City, NY-NJ-PA | -70% | |
| Ann Arbor, MI | 20% | Milwaukee-Waukesha-West Allis, WI | -65% | |
| Akron, OH | 16% | San Jose-Sunnyvale-Santa Clara, CA | -62% | |
| Fresno, CA | 14% | Raleigh, NC | -61% | |
| Cape Coral-Fort Myers, FL | 13% | Myrtle Beach-Conway-North Myrtle Beach, SC-NC | -56% | |
| College Station-Bryan, TX | 13% | Ogden-Clearfield, UT | -56% |
Middle 60% of Earners: Metros by Net Moves
| Top 10 | Gain % | Bottom 10 | Loss % | |
| Port St. Lucie, FL | 88% | Springfield, MA | -75% | |
| Deltona-Daytona Beach-Ormond Beach, FL | 79% | Fayetteville, NC | -66% | |
| Cape Coral-Fort Myers, FL | 64% | Buffalo-Cheektowaga-Niagara Falls, NY | -62% | |
| Lakeland-Winter Haven, FL | 61% | New York-Newark-Jersey City, NY-NJ-PA | -62% | |
| Stockton-Lodi, CA | 56% | Denver-Aurora-Lakewood, CO | -61% | |
| North Port-Sarasota-Bradenton, FL | 38% | Rochester, NY | -57% | |
| Fort Collins, CO | 32% | Milwaukee-Waukesha-West Allis, WI | -55% | |
| Charlotte-Concord-Gastonia, NC-SC | 17% | Omaha-Council Bluffs, NE-IA | -54% | |
| Harrisburg-Carlisle, PA | 12% | Urban Honolulu, HI | -54% | |
| Houston-The Woodlands-Sugar Land, TX | 9% | Memphis, TN-MS-AR | -54% |
Sources and Methodology
The primary source for all the data used in this study is the U.S. Census Bureau’s Current Population Survey and its Annual Social and Economic Supplements (as available via IPUMS).
All data on income, moves, their origins, destinations, and reasons behind them, as well as all estimates and percentages are based on moves within the United States.
For this study, the household income brackets were adopted from the DQYDJ data and calculated as follows:
$150,000 or more - top 20%
$30,000 or less - bottom 20%
Everyone in between - middle 60%
Net gain and loss for states and metropolitan areas was calculated as follows:
# of people moving into the state or city, to
the # of people moving out of the state or city,
expressed as a percentage (%)
Latest Research

The HireAHelper National Migration Report
Each year, HireAHelper analyzes where Americans are moving, why they’re leaving one place for another, and what that says about the economy, housing, and everyday life. The National Migration Report is our flagship study of U.S. relocation patterns, giving journalists, researchers, and industry professionals a consistent, year-over-year look at how America moves.

2025 Charlotte Moving Report
If it feels like everyone’s moving to Charlotte these days, you’re not imagining it! The Queen City is one of the fastest-growing places in North Carolina and the entire Southeast. According to our 2025 North Carolina Migration Report, 147 people move to Charlotte every day, part of a larger trend that has made North Carolina a top-five destination for movers nationwide. It’s drawing talent from across the state and beyond, reshaping how North Carolina grows and cementing its role as one of the country’s most dynamic cities.
We created this report to show what’s fueling that growth, who’s coming here, and what it means for people who already call Charlotte home.

The Future of Homeownership 2026
In 2026, the American Dream is facing a reality check. The median U.S. home price has climbed to $390,300 and is projected to reach $527,525 by 2031 - a 35.1% increase in just five years. But incomes aren't keeping up, despite growing minimum wages. Across the country, the gap between what people earn and what it takes to buy a home is widening fast, pushing homeownership further out of reach for millions of Americans.
This is a nationwide affordability crisis with sharp regional divides. In some states, buying a home still aligns with what the average household earns. In others, even an income of $100,000 falls short.
Using median home prices, household incomes, and five-year projections, this report reveals where Americans can still afford to buy today, where affordability is deteriorating fastest, and which markets may become realistic, or completely out of reach, by 2031.

2023 Study: 3 Million Moves Driven by Extreme Weather Events Last Year
In this study, HireAHelper takes a close look at moves forced by natural disasters in the United States.
Using the most recent data from the Census Bureau’s large-scale Household Pulse Survey and Current Population Survey, we focused on the number of disaster-forced moves over time, their typical destinations, as well as the types of disasters forcing most Americans out of their homes.

Study: How Much Does Moving Cost in 2023?
Driven by record inflation and rising fuel and vehicle costs, U.S. moving costs reached an all-time high in 2022. The average cost that year was $410—peaking at $454 in August—representing a 7% increase from 2021.
Prices have not yet given way; data from the first five months of 2023 shows an average moving cost of $399, which is 4% higher than the same period last year. It remains uncertain whether these costs will stay elevated or decline, which states will experience the sharpest price hikes, and if any areas will become cheaper.
2023 Study: Corporate Relocation at Highest Rate Since 2017
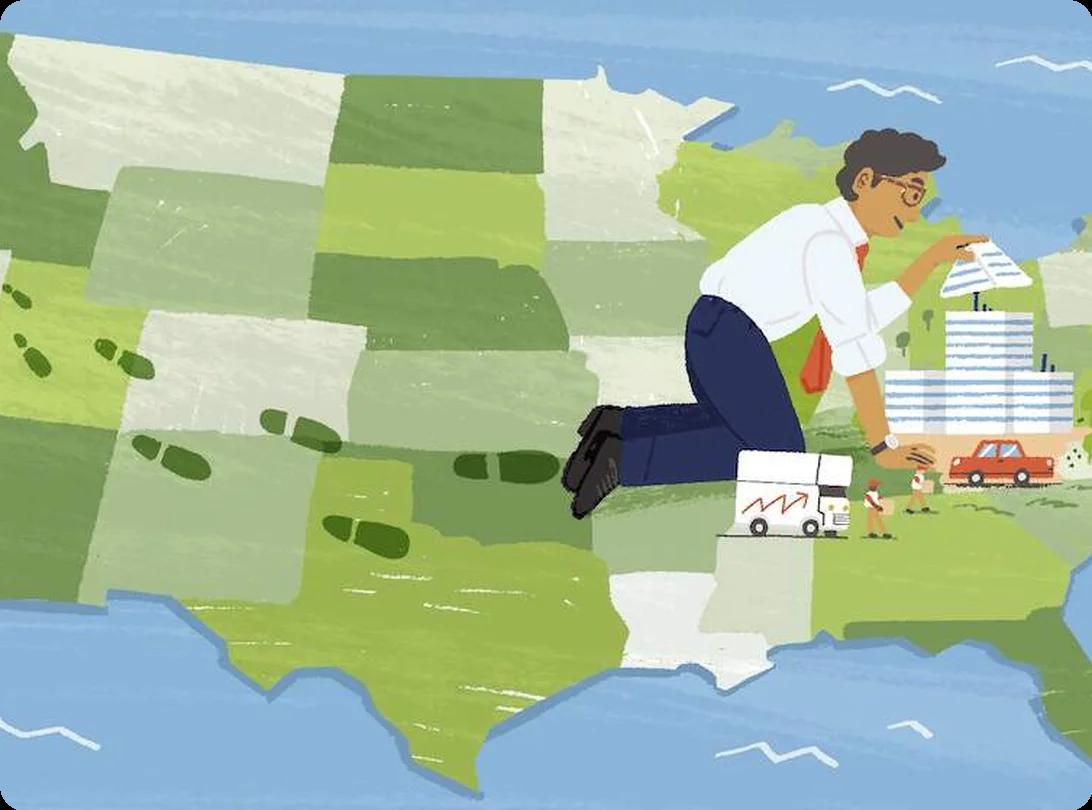
Whether to cut costs, gain a more beneficial tax rate, or be closer to a target market, about 9% of corporations in the United States moved their headquarters within the past fiscal year — the highest percentage since 2016-17, according to Securities and Exchange Commission (SEC) filings.
States like New York and cities like Seattle are seeing corporate headquarters move away, while smaller cities outside large urban centers are becoming new homes to big companies in tech and pharmaceuticals. Our study breaks down where companies are moving to, which states and cities they’re leaving behind, and whether workers are on board with following their employer to their new HQ location.

2023 Study: Where, How and Why Are Americans Moving This Year?
Every year, millions of Americans move, and over half (52%) of those moves take place during what we in the moving business call “moving season” — otherwise known as the summer months of May through August.
So what does the moving season hold for us this year? To get a sense of how many Americans intend to move, when they’re going to move, and what drives their moving decisions, HireAHelper conducted a nationally representative survey of 2,000 adults in the U.S. earlier this month.

2023 Study: The Strictest State Laws for Moving With Pets
Moving to a new state can be a stressful experience when you have a furry friend to take along. Relocating with a pet requires additional planning and preparation, as the majority of states require cats and dogs to have a valid health certificate and a current rabies vaccination, at the minimum.
Some states, like New York or Nebraska, impose additional requirements for health certificates and vaccinations. Others, such as Maine or New Jersey, allow cats and dogs to move in without any proof of health status or vaccination at all. It can get kind of confusing!Read on to see which states are the strictest in terms of moving with a pet, see which are the most lenient, and find out whether it’s cats or dogs that face the most scrutiny when moving across state lines.

2023 Study: The Shocking Rise of Eviction- and Foreclosure-Related Moves
One of the most striking and worrying findings from our latest migration report was that last year, the number of Americans who moved due to "foreclosure or eviction" was 56% higher than the year prior.
To better understand this trend, we delved into these worrying figures to see who has been the most affected, as well as to highlight where in the United States the number of moves resulting from evictions and foreclosures is rising most rapidly.

2023 Study: Majority of Renters Priced Out of Homeownership in 78% of All US Metros
In 2022, a study by Porch, a nationwide home-service company, found 61% of renters in the U.S. were priced out of homeownership, meaning they were not able to afford to buy and own a home in the same city where they rented.
In 2023, applying that study's same methodology to the most recent home-owner data resulted in an estimate of 63%. In other words, today, nearly two-thirds of renters can’t afford to buy a home in the metro where they live.To gain a better understanding of this huge number, we examined housing affordability by comparing renter incomes to home prices using the most recently available data for 260 metropolitan areas in the United States.

The Schools With the Biggest Pull: A Study of Moving for College in the US
As college enrollment declines and an increasing number of students are choosing to go to college in their home state, which U.S. colleges and universities continue to see a steady stream of American students from all around the country?
Based on a combination of factors, we created a "College Move Index". This is a ranking that compares top U.S. colleges on how much “pull” they have in terms of attracting new students from across the country.

2022 Study: Where Americans Moved To Retire This Year
In last year’s study of retirement moves, the COVID-19 pandemic was very much the central theme in many people's moves.
Yet while the effects of the pandemic are still being felt across the country, this year’s driving narrative has been inflation; the economy is of course connected to cost of living, savings, and home prices, all touchstones of the retirement equation.
As American retirees face an increased estimate for the amount of money needed to retire comfortably, 36% of retirees reported their living costs as higher than expected, while 56% expected to continue working after they retire. How has this impacted how many people retired this year? And where did they all go?

2022 Study: Trends and Findings From Americans Moving to Mexico
An estimated 800,000 to 1.5 million Americans now live in Mexico, and that number is growing rapidly. Driven by affordable housing, a warm climate, remote work flexibility, and close proximity to the U.S., Mexico has become a top destination.
However, this influx of higher-income expats carries a cost. Rising foreign demand is fueling gentrification, doubling rents in Tijuana, and driving up local prices in popular areas like Mexico City, Quintana Roo, and Baja California Sur.
Let’s dive into the data to see exactly how many Americans moved to Mexico in 2022.

2022 Study: Where Americans Are Actually Moving Abroad?
Two years ago, we detailed where and why Americans were moving abroad. Today, persistent issues—including historic spikes in the cost of living, chronically unaffordable housing, and major Supreme Court decisions—have fueled a growing perception that the U.S. is becoming less desirable to live in.
But what do the actual numbers show?
In this updated study, we analyze the latest data to see which countries Americans are actually relocating to, where they are searching to move next, and how these global migration trends have shifted in the post-pandemic landscape.

2022 Study: The Best Side Hustle Nobody’s Talking About Is Starting a Local Moving Labor Company
As rising inflation pushes consumer goods out of reach, 44% of Americans are turning to side hustles. While standard gigs dominate the conversation, one lucrative opportunity is flying under the radar: starting a moving labor company.
With high rent forcing relocations, demand for moving help remains strong. Unlike a full-scale operation, a labor-only business is simple to start with low overhead. If you can lift heavy items, you can realistically earn upwards of $100/hr helping people move.

2022 Study: This Is the Most Expensive Year in History To Move
In May 2022, U.S. inflation hit a 40-year high of 8.6%, sending shockwaves through the economy. For anyone relocating, the impact was immediate and historic. Driven by skyrocketing gas prices, pricier trucks, and higher labor costs, the average cost of a move jumped 15% year-over-year. HireAHelper data reveals how these compounding pressures officially made 2022 the most expensive year in history to move.

2022 Study: How Many Americans Have Moved Due to Climate Change?
While headlines warn that climate migration will reshape America over the next 50 to 80 years, significant movement is already happening today. Data estimates show that at least 220,000 Americans relocated due to climate change-related events within the last decade—with more than 75% of those moves occurring just in the last five years.
This is in addition to the 9.9 million Americans forced from their homes by natural disasters like storms, floods, and fires since 2008. Setting aside political debates over disaster origins, let’s look directly at the data on American climate migration in 2022.

2021 Study: Where Americans Moved To Retire in 2021
According to recent estimates, COVID forced up to 3 million Americans to retire earlier than planned. This development pushed the percentage of people aged 55 and over who are retired to 50%, which is 2% higher than it was before the pandemic.
All things being equal, this means we’d expect to see a spike in the number of people who moved for retirement, but that didn’t happen. Quite to the contrary, the number of retirees who moved in 2021 dropped to 226,000—roughly 43% fewer than in the year previous. It’s also the lowest number of American retirees in the last five years!

2021 Data Study: The Rise (and Rapid Fall) of Remote Workers
Working from home was something many Americans were forced into. This was rightly burdensome for some—mostly those left to juggle childcare, work, and household activities from home. Yet for others, remote work became a positive opportunity.
Some of us got to do some gardening in the middle of the workday, or skip a crowded commute, or completely move out of an overpriced city to live somewhere quaint, green, and most importantly, affordable. But now, 18 months into the pandemic, how many Americans are still working remotely? In this data study we break down changes in remote work patterns in the U.S., look at how rates of teleworking vary by state, metropolitan area and occupation, then examine whether the rise of the delta variant may have had any impact on remote work.

Moving During Delta: How COVID Affected American Moves in 2021 (so Far)
During the late 2020 pandemic, one-in-four moves were COVID-driven, primarily due to health concerns, financial hardships, or family needs.
By 2021, the moving landscape shifted dynamically. Early vaccination surges and dropping case numbers sparked public reopening, yet summer brought rising hospitalizations and threat of a new wave. Simultaneously, companies grappled with remote versus hybrid office policies, while the real estate market surged with record-high home prices and historic sales speeds.
To determine how these factors impacted moving habits, we analyzed over 57,000 moves booked via HireAHelper.com and our partners between January and July 2021.

2021 Study: Which Colleges & Universities Do Freshmen Travel Farthest For?
In fall 2020, over two million students enrolled in college. Despite a 13% drop from 2019, a five-year high of 43% relocated for school. To understand these trends, we analyzed college relocation data to see where students are moving and how many cross state lines. We also ranked top colleges by their ability to attract out-of-state applicants.

2021 Study: Are They Real? The Truth about Moving Scams
Scams cost Americans dearly — the FTC received 2.2 million fraud reports in 2020 alone, totaling $3.3 billion in losses. The moving industry is no exception, with shady movers using hidden fees, bad-faith contracts, and inflated deposits to fleece customers. Here's a look at how prevalent moving scams are, how much they cost Americans, and what you can do about it.

2021 Study: Renting Versus Buying, and How Both Are Impacting You
It’s a question at the heart of many debates and countless articles: Is it better to buy (if you can afford it) or to rent (if you can't)? Which is more financially beneficial? Which is actually more affordable, and why?
One way to think about this debate is to take the average home price in each state, then estimate your repayment based on some assumptions (e.g., 20% down payment, 3% interest over 30 years, etc.), then finally, compare that number to average rent prices. But that comparison alone doesn't tell us the true value of renting.What does? We looked at 335 of the biggest cities and metropolitan areas in the United States and broke down how rent levels compare to mortgage rates, how they stack up against typical incomes in each of these areas, and more.

2021 Study: Do People Actually Regret Moving?
Do people actually regret moving? Whether moving for a new job or to retire, moving in with a significant other, or moving back in with your parents, there are many factors at play for making the big jump.
This is why it seems perfectly natural that no matter how hard we prepare for our move, we might regret something about it afterward. And yet, most Americans who moved in the last year don’t regret their decision. In fact, most believe it made their life better, despite some reported complex feelings from those who did end up regretting their moves. Read on as we break down our most recent survey of over 1,200 people who moved over the last year.

2020 Study: Where Do Americans Move When They Retire?
Hundreds of thousands of Americans who retire each year are faced with a choice: stay put and continue living where they are, or take a leap and move somewhere they maybe always wanted to live.
It turns out that an increasing number of retirees in the United States choose the latter. In this piece, we examine how many Americans leave their homes to retire elsewhere, what states and cities they choose for their retirement, and just how likely they are to retire away from home than 20 years ago.

2020 Study: Where Are Americans From, State by State, City by City?
Americans move around a lot. Less than in years and decades, as we’ve noted in our studies, but millions of Americans move every year.
Whether it’s chasing dreams in New York City or LA, chasing the sun in Phoenix or Miami, or craving a change of pace in Seattle or Austin - many of us end up living in places far from places where we were born. In this post, we look at the U.S. states and cities to see where their residents are from. Which cities have the most diverse populations? Which states the most residents from neighboring states, and which are top destinations for expats from overseas? Read on below to find out.

2020 Study: Where Do Americans Who Leave the USA Go?
Around 10 million Americans live outside the U.S., with hundreds of thousands leaving each year for reasons ranging from career and education to love, lower costs, better climate, or simply a fresh start. But where are they going? Below are the key trends and top destinations — backed by research and statistics.

The Best Small Towns for Working Remotely in the US in 2020
As more and more people choose (or are forced) to work remotely, many are realizing they don’t necessarily have to live in the big cities where their employers tend to be based. In fact, they can move to save money. If you can work and be productive remotely, why endure a concrete jungle with barely affordable rent, high cost of living, and a crowded commute? Working from home is in.
To help all the remote workers out there, HireAHelper created an algorithm that ranks a town's internet accessibility, cost of living, and much more in order to figure out where the best places to work remotely in 2020 are.

Study: What The Great Recession Tells Us About COVID-19's Potential Impact on the Moving Industry
There’s an overwhelming uncertainty about the effect the COVID-19 pandemic will have on the US economy. This uncertainty is echoed in the moving industry, where according to our recent survey, over 80% of moving companies are worried about the future of their businesses (see Are Moving Companies Open? for updates on who's still offering moving services).
We looked at how the moving industry fared through the most recent economic crisis in the US: the Great Recession of 2008-2009, and combined that data with the most recent projections of unemployment and economic downturn to estimate the impact COVID-19 might have on the future of the moving industry.

2019 Study: Compared to Boomers, Millennials’ Rent Is More Affordable — But They Can’t Afford Homes
Do millennials have it worse than past generations?
The popular narrative seems to suggest they do. Millennials have faced higher unemployment rates and higher student debt than past generations of young adults, according to a Pew Research Center report.
We compared these generations, following Pew’s definition of each, by looking at incomes and housing costs during the years their cohorts were entering independent adulthood and becoming financially established, 20 years after their birth years:
- Baby Boomers, born 1946 to 1964
- Generation X, born 1965 to 1980
- Millennials, born 1981 to 1996
Here’s what we found, and how it impacts millennials’ moving plans and habits.

2019 Survey on Dating and Distance: How Far Are People Willing to Look for Love?
Online dating fundamentally changed how we connect with others, and even how we date and fall in love. From Tinder to Bumble, Hinge, and even FarmersOnly.com, it’s easier than ever to find a match almost anywhere in the world.
Yet, while you can connect with someone on the other side of the globe, most people say they are still looking for romance close to home. In our recent survey, HireAHelper uncovers exactly what distances people are (or aren’t) willing to go to find love.

2019 Survey: Moving for Love Is Likely to Pay Off
Most people make a move hoping for a positive outcome, maybe a shorter commute, more living space— or in the case of people moving for love, establishing a successful romance.
About one in four adults have moved for love at some point in their lives, finds our latest survey. But weighing whether one should move to be closer to a significant other can be tricky, compared to deciding to relocate for plenty of other reasons.
A new HireAHelper survey about moving for love finds that relocating for a romantic relationship actually pays off.
2019 Study: Moving Interstate Could Save (or Add) Up to $7,700 On Your State Tax Bill
Totaling up moving costs when you’re moving out of state can leave you with sticker shock.
With a typical interstate move costing about five times more than a local move, you might be wondering if it will pay off.
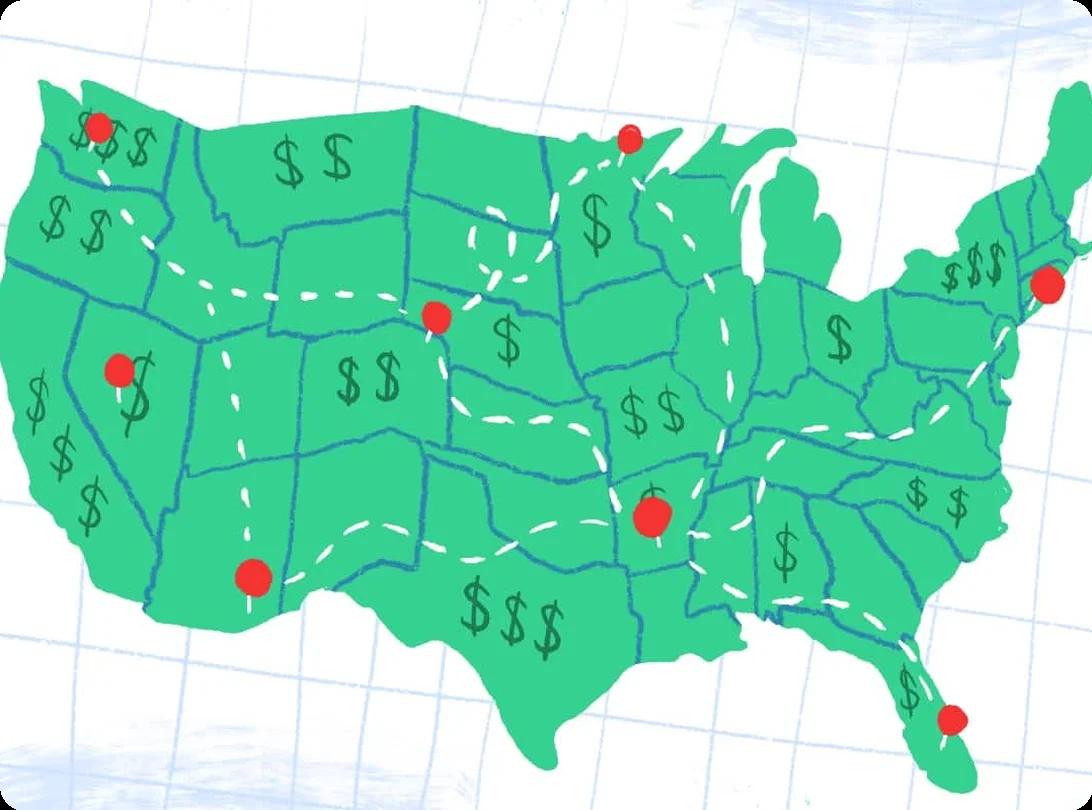
One way to gauge the payoff of moving out of state is looking at how well it will set you up for financial success. A big part of that calculus is how much moving between states could lower (or increase!) your tax bill.
HireAHelper’s latest study compares taxes on income, sales, and property in all 50 states and the District of Columbia. We found that moving between states can have a big impact on your tax bill. If you were to move from the state with the least taxes to the most, for example, you’d owe around $7,760 more in taxes each year!

SURVEY: How Has the Coronavirus Impacted Moving Companies?
There is nothing that is not being disrupted in some way, shape, or form in the wake of the Coronavirus pandemic spreading across North America.
Among those disruptions, one of the most curious dynamics to keep an eye on is the obligation Americans still have for relocating... along with their willingness to hire people to move them.

Remote Work Index: Which U.S. States and Cities Are the Best for Remote Work?
Back in 2020, HireAHelper looked at the best small towns for working remotely in the U.S., but this came at a time when workers were encouraged to work from home. Now, over four years later, things have changed.
While many people have returned to work in the office, and there’s an increase in RTO mandates from companies, there is still plenty of interest in remote working and its benefits. Some large companies continue to offer remote work to their employees, such as NVIDIA, and a recent study by the freelancer platform Upwork found that over a fifth of the American workforce (22%) is likely to be remote by 2025.
But along with the freedom of remote work comes the question: where’s the best place to WFH?

Cats vs. Dogs: Which U.S. States and Cities Are the Most Pet-Friendly?
HireAHelper loves pets, so we had our data experts analyze real estate listings to uncover the most pet-friendly cities and states around the country. Read on to find out which states and cities are the most welcoming for pets.

Millions Moved During Covid, Here’s How That’s Working Out
While lockdowns kept us in one place during the COVID pandemic, many Americans still moved during this global crisis—many, because of it. Looking back over the span of the pandemic thus far, how have so-called "pandemic moves" worked out for those who made them? To find out, HireAHelper spoke to people who moved during the pandemic to get a closer look at the unique obstacles and opportunities that drove their decisions to move.

The New Retirement Map: Where Retirement-Age Americans Moved in 2025 and Why
Retirement in America is being redefined. It’s no longer just about snowbirds and waterfront communities. Today’s retirees are more mobile, more selective, and more strategic about where and how they live than ever before. Using PGM's proprietary database of almost 15 million nationwide adult moves in the last 12 months, we analyzed where Americans aged 65 and older relocated, how far they moved, and what kinds of homes they chose. The result is a clear picture of modern retirement migration, one driven by affordability, comfort, and long-term livability.

2023 Study: Moving Scams Up 12% Over Last Year
Moving scams may have dipped in 2022, following their peak during the COVID-19 pandemic years. But according to the Better Business Bureau’s Scam Tracker, they are on track to increase 35% year-over-year.
In response to this trend, the Federal Motor Carrier Safety Administration (FMCSA) launched an operation called Protect Your Move in April of this year. This is timely, as our data indicates almost half (45%) of all the moves in any given year take place from May through August. As we're currently within the period that we in the business call "the moving season," let’s look at the latest trends in moving scams, review which scams are the most common in 2023, and where these scams are most likely to happen to you.

2023 Study: Insights Into the 26% of Americans in the Sandwich Generation
Meet the Sandwich Generation — adults who are “sandwiched” between their aging parents and their children by having to financially support and/or care for both.
Why do so many Americans find themselves in this living arrangement? It’s a mixture of both demographic and socio-economic factors. For this study, we surveyed 1,000 members of the Sandwich Generation to find out more about their family situation, the challenges they face, and their feelings about it. We also combined our findings with the U.S. Census Bureau data to estimate the number of people in the Sandwich Generation and how they’re spread across the United States.

2023 Study: Which College Towns Have the Best Real Estate Investment Potential
As a new crop of college students start class this September, the cost of attending college has never been higher. At four-year colleges, room and board alone costs around $12,000 to $13,000 per year.
That cost is pushing some parents towards buying a home close to their child’s college campus — even if the school might be far away. Renting in college towns remains expensive, but buying a home and renting out part of it could help cover mortgage repayments and so long as prices keep appreciating, it can be a good investment. In this study, we rank over 500 college towns on their real estate investment potential based on current home prices, historical and projected growth, housing availability, and potential rental income. Read on to see which college towns score the highest, and where you might want to consider making your new home.

2023 Study: 3 US Towns Have Dropped to 0 Citizens Since 2010, Which Ghost Town Is Next?
Are there places where people once lived, but today lack any citizens? In fact, three places in America have become ghost towns since 2010, and another 39 saw their population dip to below 10 people, according to the latest population estimates by the U.S. Census Bureau.
These aren’t just outliers, but the mark of a trend. In America, as of 2010, 61% of towns with fewer than 10,000 residents have had a population decline. (Meanwhile, 82% of cities with at least 100,000 residents had increased their population during that same time period.) We are taking a closer look at America’s smallest cities, towns and communities to see what may have contributed to their decline, as well as highlight the fastest-emptying towns for every state.

2023 Study: Where and How To Earn the Most Money From a Moving Labor Side Hustle
When we released our last study of starting a moving labor company as a side hustle, it was a great time to get into the business. Home sales were at an all-time high, and the number of Americans who moved that year inched up for the first time in a decade.
However, after only one year, the housing market has cooled off. And even though sales of newly built homes are still up 6%, home sales as a whole aren’t as high as last year.
The cost of moving has also grown 4% in 2023 (ahead of inflation rates), and this is actually good news! It means movers’ earnings have most likely also increased. So if you're interested in adding a side hustle to your income, starting a moving labor company is well worth considering.

2023 Study: Where Americans Are Moving Abroad Post-Pandemic
When we last covered the topic of Americans moving abroad in late 2022, the interest in leaving the country was the highest it’s been since the Presidential Elections in 2016.
This year, despite a 30% reduction in moving-abroad-related Google searches, American moves outside of the country don’t seem to be slowing down. In fact, more Americans moved to the UK, Mexico, and Canada so far in 2023 than at this time last year.
In this year’s study, we chart the updated numbers of Americans moving abroad, look at top destinations overall, and highlight the fastest-growing areas in recent years.

2022 Study: Are Americans Giving Up on Moving for Love?
When the late, great Meatloaf sang about doing anything for love — except that — maybe he was referring to moving.
About one in four adults have moved for love at some point in their lives, according to a 2019 HireAHelper survey. But it appears that far fewer people are doing so today. In 2020, approximately 1,527,685 people moved for romantic reasons. By 2021, that number dropped to 1,067,234, representing a 30% drop.
It may be that pandemic-era flings are losing their luster, or most everyone interested in shacking up already has. But which generation is most likely to relocate for love? And where are they going?

2023 Study: The Year Gen Z Adults Moved More Than Any Other Generation
Generation Z — or Zoomers, as they're sometimes called — have been the subject of many headlines lately. As they come of age, their differences from other generations in terms of workplace habits, home ownership ambitions, political views, and the use of technology are increasingly well-documented.
But what about moving? We know that Gen Z, like the generation before them, is burdened with less favorable economic outlooks, including poor housing affordability, high rent, and student debt. Presumably, in light of these factors, some surveys find a record number of young adults are staying put and living with their parents.
2024 Study: A Look at the Biggest Wave of Retiree Moves in Three Years
The year 2023 was a big year for retirement moves!
According to the U.S. Census Bureau data, retirement moves reached a three-year high! With housing markets cooling off, inflation slowing down, and social security benefits increasing, it's no surprise that 44% more Americans moved in retirement compared to in 2022. How else have these developments affected moving after retirement in 2023? Where did retirees relocate to, and which places did they leave behind? In this latest edition of our annual retirement moves study, we look at trends that shaped moving in retirement in 2023, highlight top origins and destinations, and zoom in on the changing demographics of retirees on the move.

2024 Study: Half As Many Millennials Move as a Decade Ago. Where Are They Going?
Millennials (born 1982–2000) are entering middle age facing unexpected financial strain. Despite being top earners, they carry the second-highest level of household debt. While over half finally own homes, 16% still live with their parents.
Economic challenges peaked recently with historic mortgage rates and the worst home sales market in 28 years. Consequently, millennial mobility has plummeted; the number of moving last year was half of what it was a decade ago. To understand these shifting living situations, this study analyzes US millennial migration trends, highlighting the specific cities and states seeing the highest influx and exodus of this generation.

2024 Study: Who's Moving to Florida and Why?
In a 1991 Seinfeld episode, Jerry joked that moving to Florida at age sixty was "the law." While reflecting a long history of attracting retirees, viewing Florida solely through this lens is reductive. During the 1990s, 4.3 million Americans relocated there, making it the top destination for nine out of ten years.
Today, employment dominates migration; "new job or transfer" drove over 54% of moves to Florida in 2023. Using Census and HireAHelper data, this study analyzes current trends shaping Florida migration, tracking resident demographics, regional shifts, and the evolving reasons driving people to move to or from the state.

2024 Study: ‘Brain Drain’? The States With the Largest Net Gains and Losses of College-Educated Americans
A 2019 U.S. Congress report defined "brain drain" as highly educated adults aged 31 to 40 leaving their birth states, finding that the Southeast and Rust Belt were losing talent to the West Coast. However, a recent New York Times analysis revealed a reversal: skyrocketing costs of living are driving college-educated Americans away from coastal hubs like San Francisco and New York toward states like Georgia and North Carolina.
Are educated professionals favoring coastal opportunities or fleeing them for affordability? This 2024 report analyzes these conflicting trends to identify which U.S. cities and states are truly winning and losing the nation's top talent.

HireAHelper’s 2024 Moving Survey: 30% of Americans Plan on Moving This Year
It’s officially moving season, AKA the four months of May through August when the majority of moves in the United States take place every year.
HireAHelper's yearly Moving Season Survey asked over 2,000 Americans what their moving plans are for 2024. What did they say? Where are people going? And why? We looked at how many Americans plan on moving this year, what was behind their decision to move or stay put, and how this year’s trends and developments might affect moving patterns in America this year.

2024 Study: Moving Costs Set To Reach a Five-Year High
In last year's Moving Cost Survey, we found that more than half (52%) of our respondents had no plans to move in 2024, stating they couldn’t afford it. Unfortunately, the economy has likely done little to help change their minds over the last year.
During the first five months of 2024, the average move has cost about 2% more than during the same 5-month span in 2023. That's especially notable because we haven't even hit the peak moving summer months in 2024! In this year's study, we examine all the trends impacting the cost of moving, check where moving is spiking the most and where it may be getting cheaper, and see what those who plan on moving can expect to pay this year.

2024 Study: Moving Scams Falling in the US, But Growing Costlier
Moving scams continue to persist, but by how much?
Last year, the number of complaints lodged against moving companies with the Federal Motor Carrier Safety Administration (FMCSA) was 8,769, a 15% increase over 2022. FMCSA complaints span a whole range of issues, including non-licensed movers, no-shows, hostage loads, and more.
What about this year? In this study, we explore the most recent trends in moving scams, see which scam and fraud types are the most prevalent, and highlight the states and cities where moving scams appear to be on the rise.

2026 Millennial Migration: Where the Largest Generation Is Headed Now
Millennials are no longer the "young movers" of the U.S. housing market. Instead, they are now the country's primary economic drivers, shaping housing demand, labor markets, and population growth across the country.
Using PGM's proprietary database of nearly 15 million nationwide adult moves between January and December 2025, we analyzed where Americans born between 1981 and 1996 relocated, how far they moved, and what types of homes they purchased.
The result is a clear picture of modern millennial migration, one driven by affordability pressures, shifting job markets, and a growing tendency to skip the traditional starter home altogether.

2024-2025 Retirement Study: Where and Why Retirees Moved This Year
Each year, our Retirement Study analyzes where and why Americans choose to move during retirement. Using the latest data from the U.S. Census Bureau, we track shifts in migration patterns, uncover the top destinations and origins, and explore the evolving motivations behind retiree moves.

2024-2025 Millennial Study: 1 in 10 Millennials Moved in 2024 but Which States and Cities Saw the Biggest Gains?
Understanding where millennials are moving provides key insights into economic shifts, housing demand, and workforce distribution. This report analyzes millennial migration trends across the U.S., identifying the states gaining and losing millennial movers.

The Rise of America’s New Boomtowns in 2025
We ranked U.S. cities by population growth, job gains, and income trends to uncover today’s top boomtowns.
Some cities are growing — and not just by a little. To find out where momentum is strongest, we analyzed migration trends, employment shifts, and income changes across dozens of U.S. metros. By looking at how these factors changed between 2018 and 2023, we identified the cities where growth isn't just happening — it's accelerating. The result is a ranking of America’s emerging boomtowns: places attracting new residents, expanding their economies, and seeing incomes rise faster than the national average. While some well-known cities continue to thrive, a growing number of smaller metros are quietly reshaping the national map by offering more affordable housing, stronger job markets, and a better quality of life. Here’s where the next wave of growth is taking shape.

The Future Homeownership Report
In 2025, the U.S. housing market is expected to remain largely frozen with limited growth, according to a J.P. Morgan report. The report also cites other challenges facing potential homeowners and movers, such as rising house costs, stagnant wage growth, and even recent governmental policies on immigration and tariffs set to affect housing affordability.
To find out where Americans may be priced out of property in the future, we created a 5-year projection which analyzed the historical progression of house prices and household income for each city and state in the U.S. By looking at how these rates increase from 2025 to 2030, we identified where residents might not be able to afford to buy a home in the future. Some states, such as Montana, will see their household income needing to increase by up to 144% for residents to afford a home in 2030, while other metro hotspots are experiencing projections as high as 517%.

The Hidden Health Toll of Moving
In this report, the moving experts at HireAHelper uncover the hidden health costs behind every relocation, from joint pain and burnout to anxiety, insomnia, and even trauma-level stress. Based on a survey of over 1,000 Americans, we reveal exactly why people find moving so stressful as well as the health effects they’ve experienced along the way.
Texas Migration Report: Where America Is Moving and Why It’s Still Texas
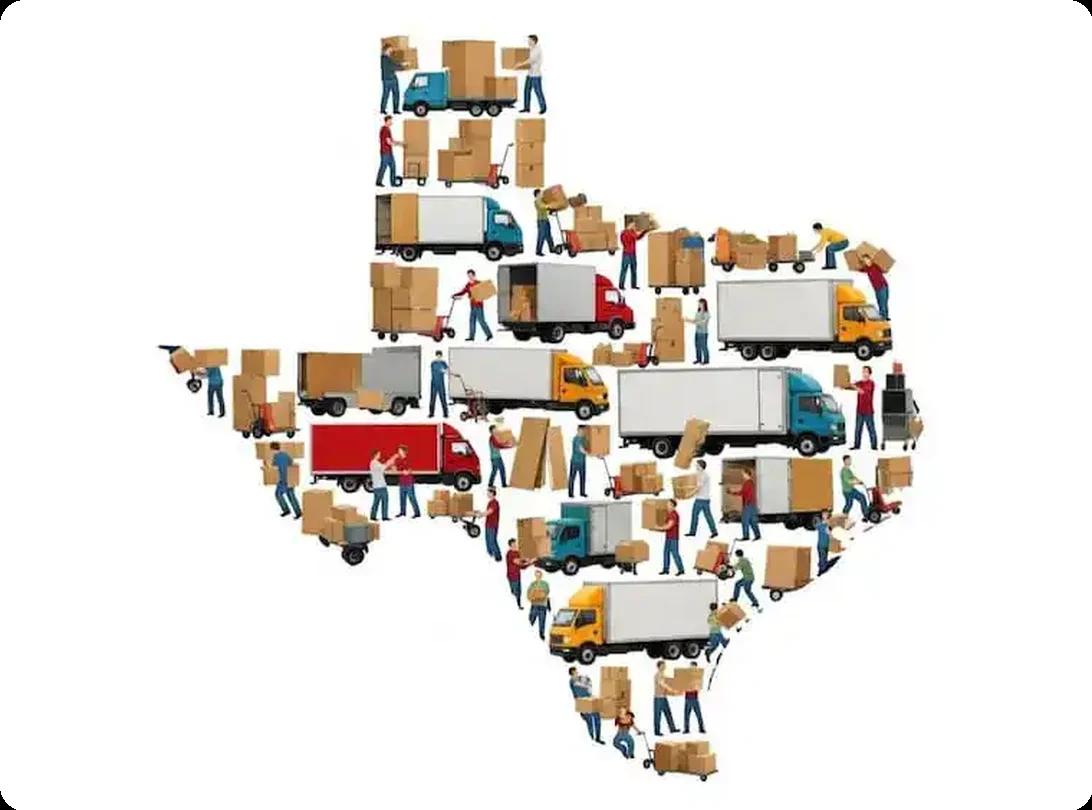
Everything is bigger in Texas—including its population boom. According to the 2025 Texas Migration Report from HireAHelper, more than 265,000 Americans relocated to the Lone Star State over the past year, averaging an impressive 726 new arrivals every day. Driven primarily by Gen X and millennial professionals from states like California and Florida, this massive migration wave is fueled by Texas' affordable housing, lack of state income tax, and robust job opportunities. Discover the latest data on which Texas metros are growing the fastest and why the state remains America's premier relocation destination.

Colorado Migration Report: How the Centennial State’s Moving Patterns Stack Up
Colorado’s shifting landscape is undergoing a demographic trade-off. The 2025 Colorado Migration Report from HireAHelper reveals that despite attracting over 102,000 out-of-state newcomers, the Centennial State suffered a net loss of nearly 9,500 residents as outbound migration outpaced inbound moves. Driven primarily by high housing and living costs, middle-income earners and Baby Boomers are leaving—often heading to Texas and Florida. Meanwhile, affluent millennials and Gen X professionals continue to pour into the state, primarily from Texas and California. Read on to see how these economic pressures are reshaping Colorado's major metros and mountain towns.

The Best U.S. Cities to Move to for Raising Children
When it comes to raising a family, the right environment can make a world of difference, which sometimes means making a move. But whether you're relocating for work, a better school district, or for other reasons, there are important factors to consider. To help families make informed decisions that reflect their unique goals and priorities, and dreams, the team at HireAHelper has conducted a comprehensive study of city characteristics that could influence children's health, happiness, and success.
Based on our ten-factor analysis, we’ve provided a list of the best cities to raise a family in the United States, so you can make an informed decision for your own when it comes time to move.

2025 Austin Moving Report
If you live in Austin, you've probably noticed it: the traffic's worse, your favorite taco spot has a longer wait, and it feels like everyone you meet just moved here. It’s not your imagination!
We recently put together a 2025 Texas Migration Report looking at moving patterns across the state, and Austin stood out as one of the fastest-growing metros. We dug deeper and discovered that, based on our 2025 data, 154 people move to Austin every day from outside the metro area.
We decided to take an even more detailed look, so this report breaks down who's moving to Austin, where they're coming from, and why.

2025 Denver Moving Report
Moving to Denver has been a steady trend for years. Even though Colorado as a whole saw a net loss in 2025, Denver gained 237,197 new residents, which is almost 19% of the state’s total movement. Denver continues to be the top metro destination in Colorado. More people move into the city than anywhere else in the state, but it also sees the most people leaving. This means the area is in a constant cycle of turnover, growth, and renewal. For anyone planning a move to Denver, this clear, data-backed report can help you understand where people are coming from, where they are going, and what this movement means for housing, jobs, and daily life.
2025 North Carolina Migration Report: Why the Tar Heel State Is a Top 5 Destination for Movers
North Carolina’s appeal continues to skyrocket. According to the 2025 North Carolina Migration Report from HireAHelper, the Tar Heel State captured a net population gain of over 47,000 new residents last year, ranking as the 5th most popular destination in the country. Middle-class Gen X and millennial families are flocking to major hubs like Charlotte and Raleigh, leaving high-cost states in search of better career opportunities and cheaper housing. Dive into the complete report to discover the driving forces behind this Southeast migration boom and explore how local metros are evolving amid the growth.

Every Major Moving Report of 2017 Analyzed: Where Is Everybody Going?
Migration reports are out in full force, including the famous United Van Lines yearly report. But while United handles more moves annually than any other mover network in the country, their numbers are not definitive across the industry board. North American, Atlas and Allied all see slightly – and in some cases, wildly – different results in their migration study results. Not a surprise, because as a Full Service move provider, United handles a somewhat different clientele compared to companies like ABF, U-Haul and PODS – companies whose numbers might look a lot different. Then there's that little thing called the Census. Yep, the state-to-state migration numbers for 2017 are out – and folks, we have new inbound state champions! Here are the results.

Constantly on the Move? Here Are 50 of the Most Move-friendly Jobs in the US
A few years ago, only freelance and tech roles allowed for frequent moving. The pandemic changed everything, proving many occupations can be done anywhere, permanently shifting the remote workforce.
Concurrently, the "Great Resignation" saw workers flee hospitality and food services for careers with better pay and work-life balance. These trends sparked an upswing in overall, work-related moves. Unsurprisingly, the top remote jobs belong to software developers.
With Americans prioritizing geographic freedom, HireAHelper compared over 300 occupations to find the best jobs for frequent movers. Our study highlights top remote careers, high-demand on-site jobs nationwide, and the best options for mobile workers who don't have a college degree.
The 2026 HireAHelper Moving Migration Report
In 2025, Americans didn't stop moving, but how and where they moved shifted in meaningful ways. More people chose to relocate within their own state rather than cross long distances, smaller metros outpaced major cities on a per-capita basis, and economic opportunity mattered more than just lifestyle alone. Together, these patterns point to a year defined less by dramatic relocation and more by deliberate, calculated moves, shaped by affordability, job stability, and long-term financial considerations.
The 2026 HireAHelper Migration Report is our annual deep dive into how, where, and why Americans moved in 2025. Now in its fifth year, the report reveals what made 2025 distinct: a slower overall moving year that still produced intense migration pressure in specific states and metros, particularly across the Southeast and select secondary markets.

The 2024-2025 HireAHelper Moving Migration Report
In 2024, Americans faced a unique set of challenges that shaped their moving decisions. Rising moving costs continued to strain budgets nationwide, while environmental factors such as wildfires, flooding, and extreme weather played an increasingly prominent role in relocation choices. A total of 25.87 million Americans (that's 7.8% of the population) moved this year, which might seem like an impressively high number, but it's actually in line with the historic lows seen in 2023.
The 2024-25 HireAHelper Migration Report offers a closer look at these trends. By analyzing over 114,000 moves booked through HireAHelper.com, insights from our 2024 customer survey, and the latest U.S. Census Bureau data, the report uncovers the key factors shaping how and why Americans moved this year.