
Nov 4, 2025
Moving is hard — finding trustworthy advice shouldn't be. For nearly two decades, HireAHelper has helped people complete over a million moves, and we've turned everything we've learned into the practical guides, checklists, and expert tips you'll find here. Whether you're moving across town or across the country, packing a single room or a whole house, our advice breaks every step down so you can move with less stress and more confidence.
HireAHelper makes booking trusted moving help simple. Compare licensed, background-checked movers near you using real customer reviews and upfront pricing, then book the right crew — for loading, unloading, packing, or your entire move — in just a few minutes.
Nov 4, 2025
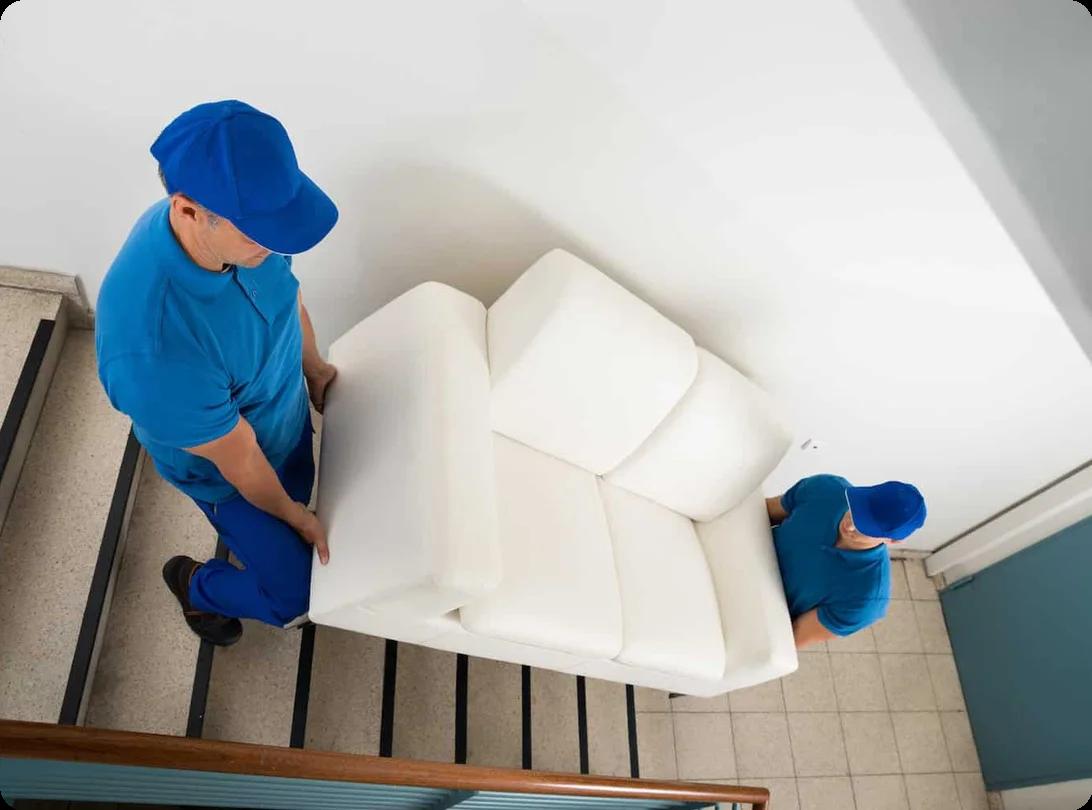
Figuring out how to navigate a steep flight of stairs with a heavy couch or dresser can quickly become the most stressful part of your move. To carry these items down stairs safely, you need to measure your... Read More

Professional packing can take anywhere from 2 hours for a small apartment to a full day or more for a larger home. The actual timeline depends on how much you own and how prepared you are when the crew arrives. In... Read More
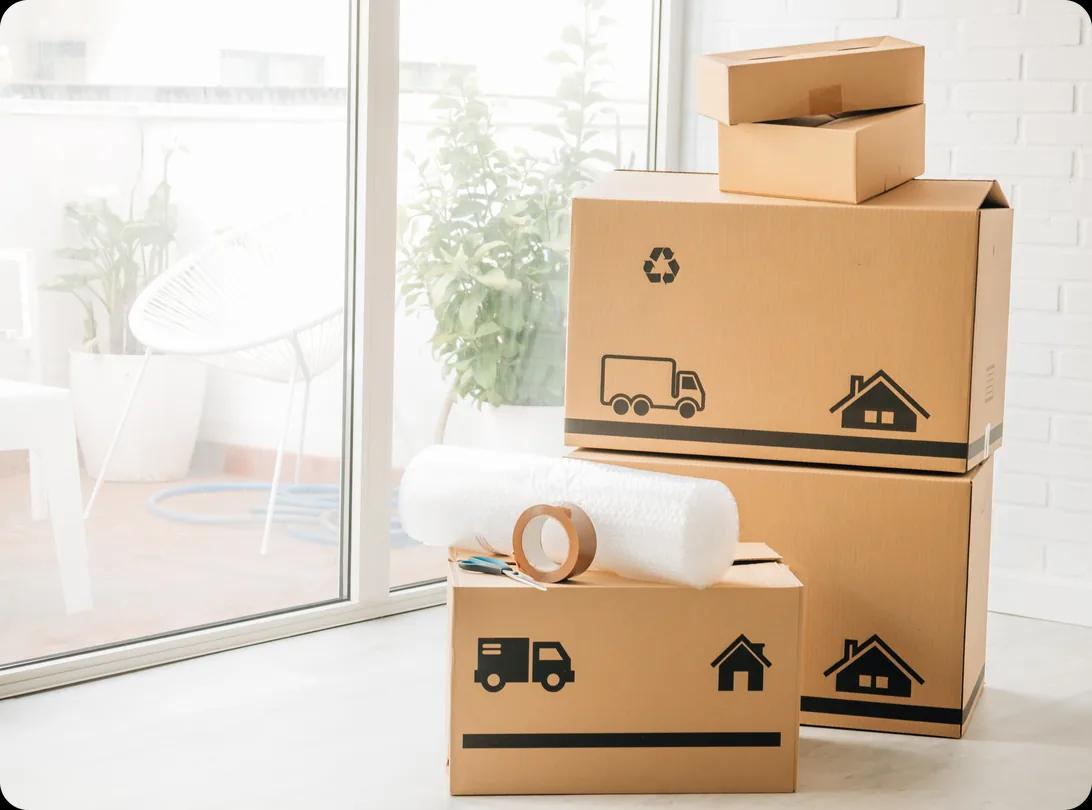
Packers do not always bring their own boxes, including when you book labor-only packing help directly or through HireAHelper. What supplies they bring depends on the type of packing service you choose. With... Read More

Choosing between a moving broker and a carrier comes down to how much control you want over your move. A carrier is usually the better choice if you want to work directly with the company handling your belongings.... Read More
The best way to load a moving truck is to load the heaviest items first and save light or fragile items for last. That order gives your belongings a stronger base, helps prevent shifting in transit, and makes the... Read More
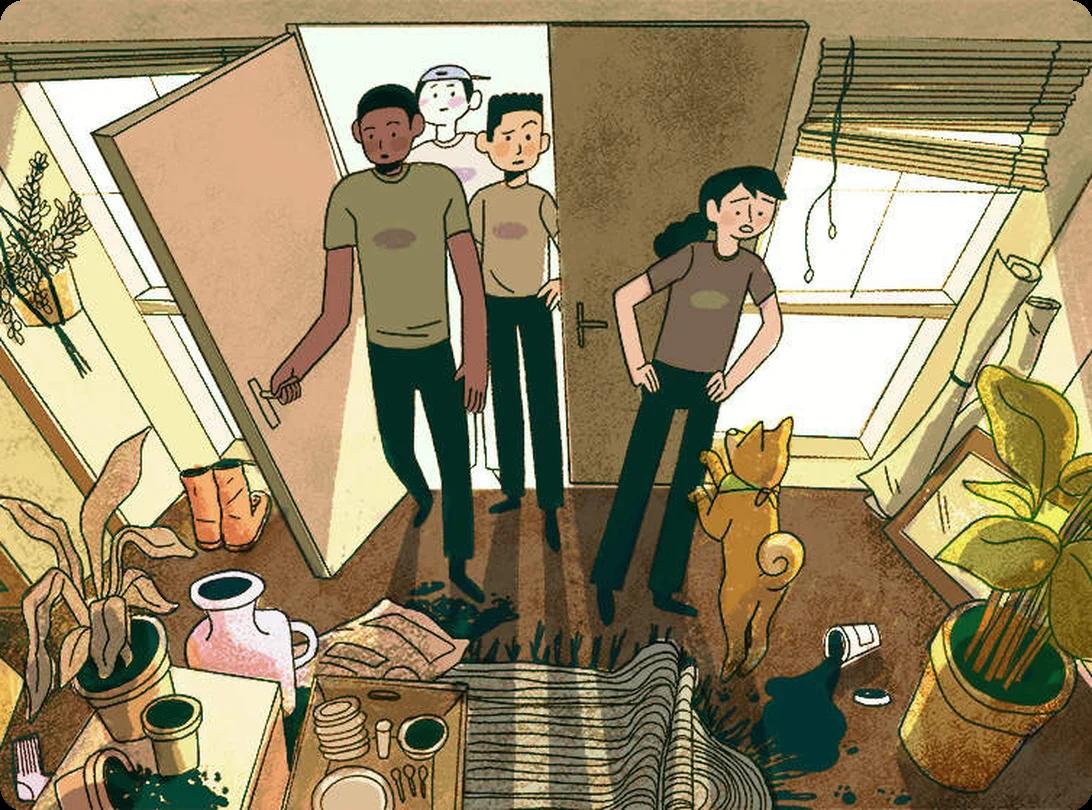
No, you're not supposed to help movers lift boxes or carry furniture. Stepping in uninvited can create real liability issues for you and the crew you hired, in addition to slowing things down.
Even though you're not... Read More

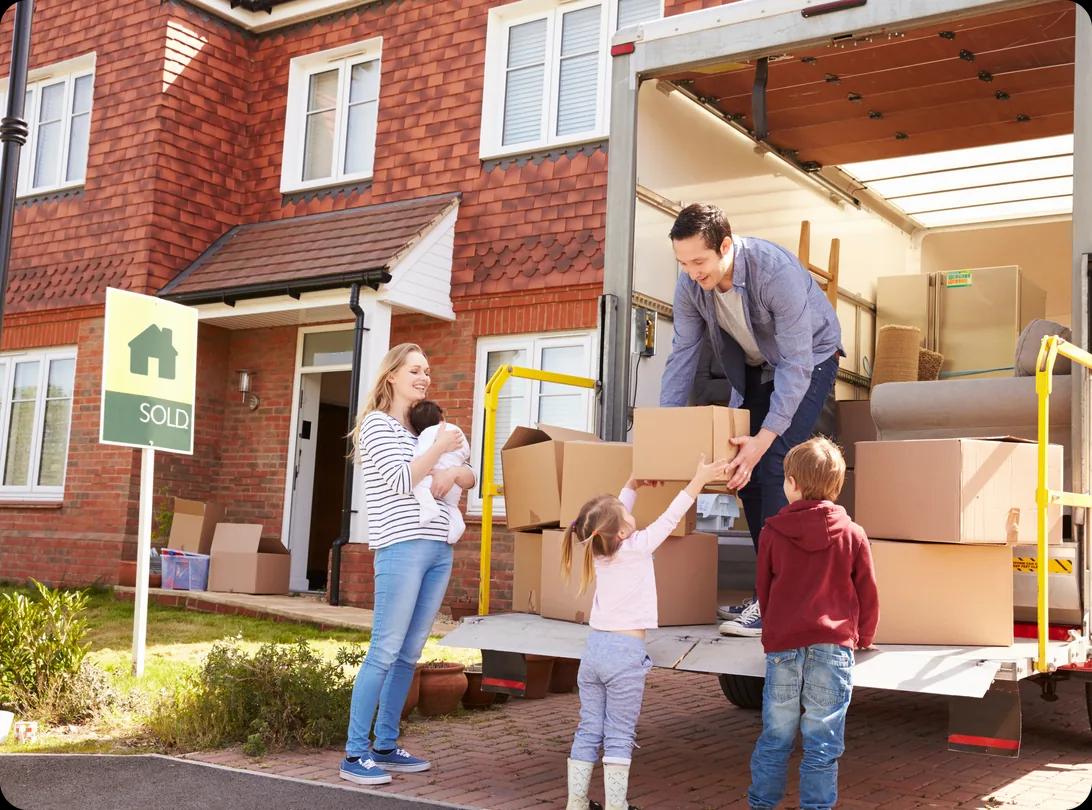
Figuring out how to start over in another state can feel overwhelming — just ask the 3 million Americans who moved states in 2025. But moving to a new state is more manageable if you prepare financially, give... Read More
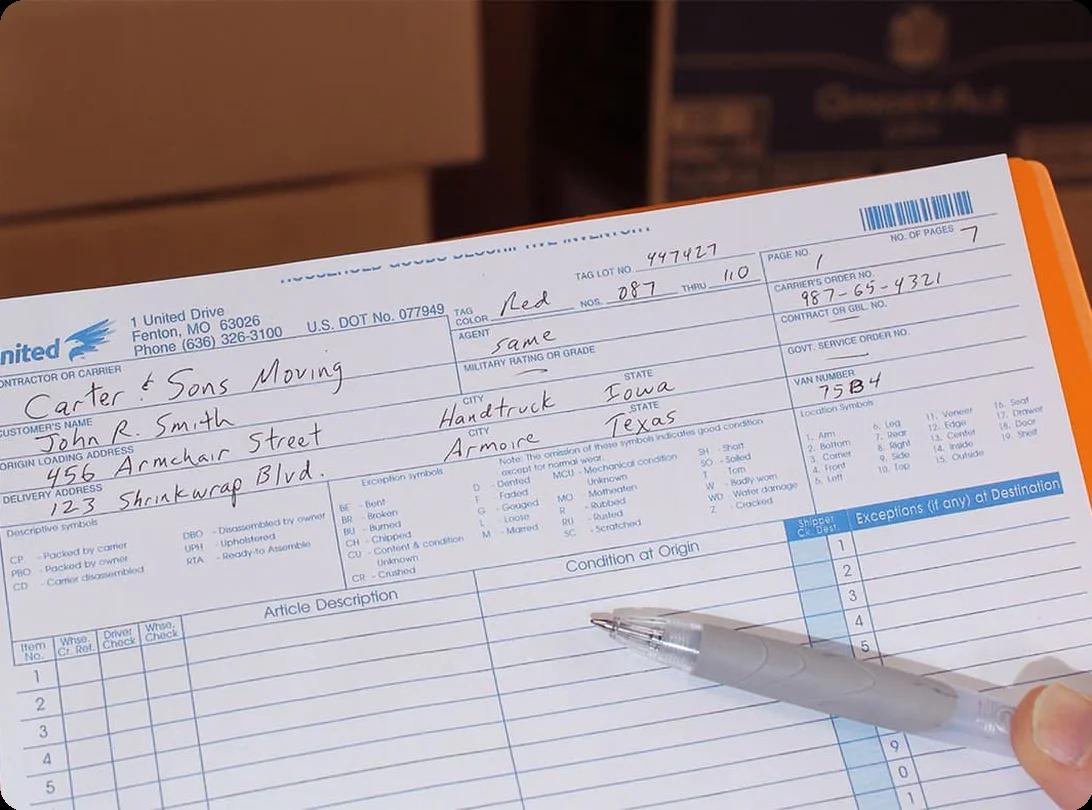
Moving day gets confusing fast when every box looks the same, and no one remembers where the coffee maker, chargers, or bedding is. A moving inventory list helps you track what you packed, where it is, and what... Read More
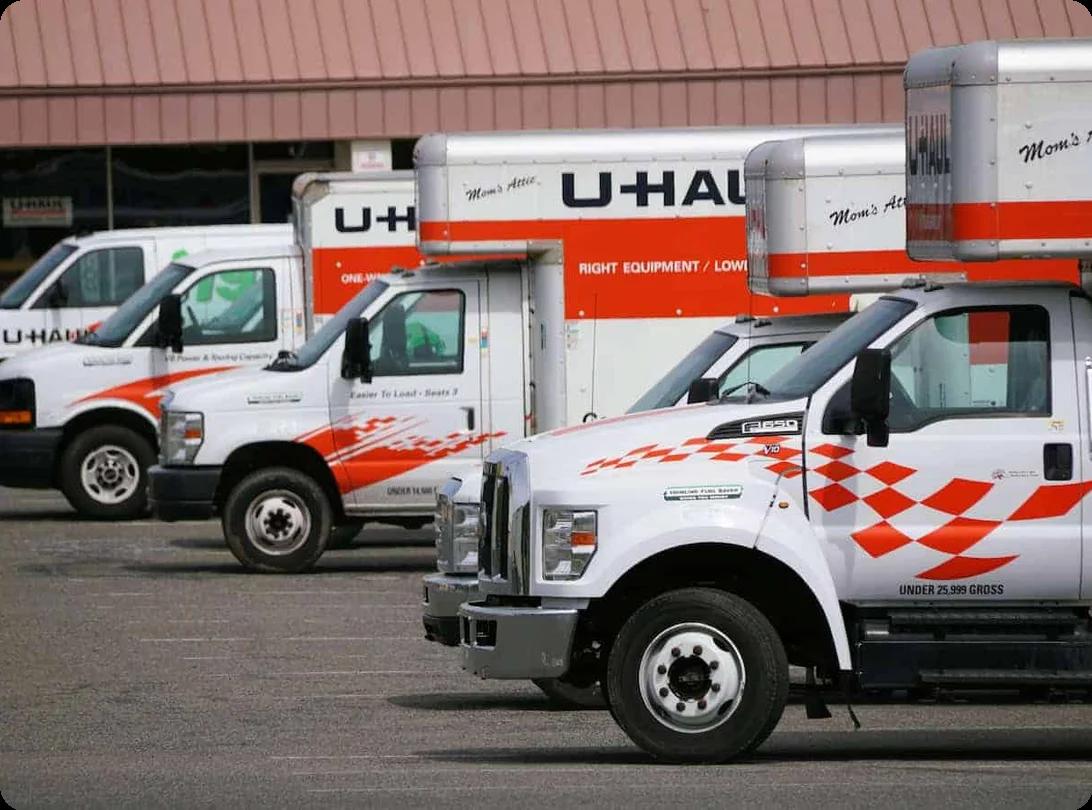
The best U-Haul alternative depends on what kind of move you’re doing. For a long-distance move, Penske is a great first place to check because the trucks are known for being comfortable on longer drives, and most... Read More
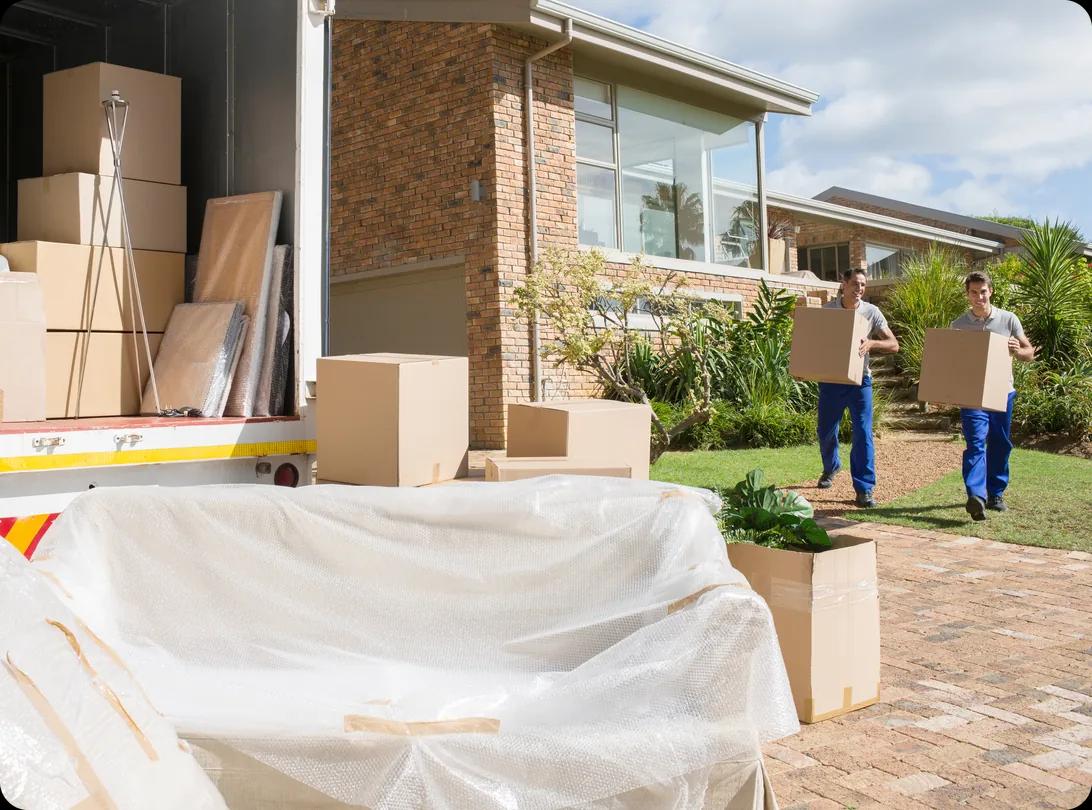
In general, loading takes about 1.5 – 2 times longer than unloading, or about 60% to 75% of the total hours. This is because when loading, you need to take the time to distribute weight carefully, secure items, and... Read More
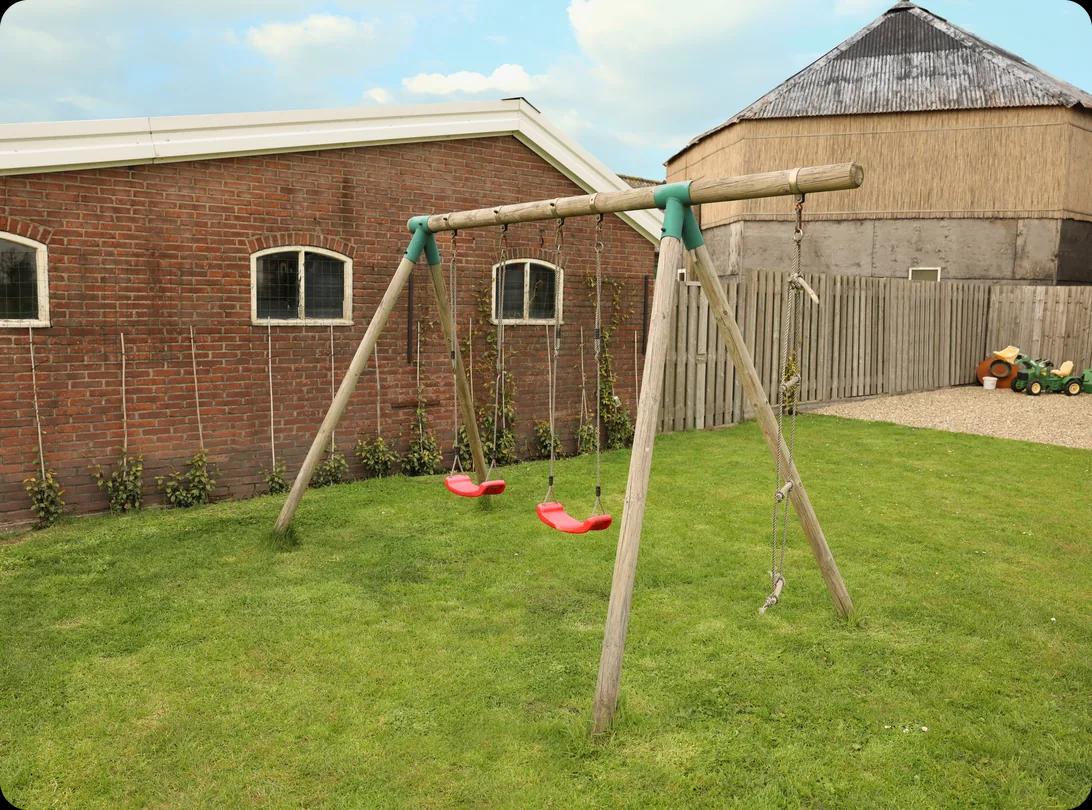
Yes, professional movers can move a swing set. Most will need it taken apart first, and there might be extra charges for things like size, weight, or putting it back together. If you have a solid wooden playset,... Read More
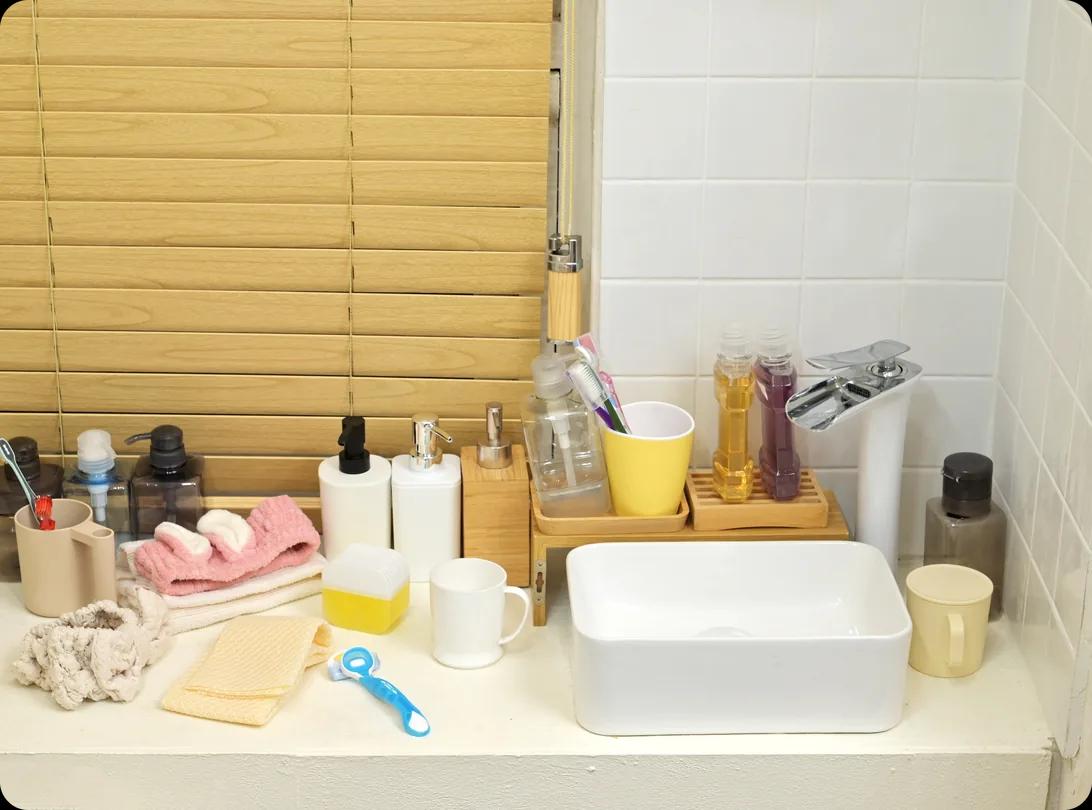
The bathroom can be tricky to pack. It’s one of the last rooms you get to because you use it regularly, and it’s filled with items that can break or spill, but there are techniques to make this area easier to move.... Read More

Hiring movers is worth it when the cost (usually about $80 to $240 per hour depending on crew size and service type) saves you from heavy lifting, injury risk, tight timelines, or damage to your belongings. What... Read More

To pay someone to help you move, expect to spend $40 to $75 per hour for a labor-only mover or $100 to $150 per hour for a full-service team of two. Knowing these numbers upfront matters because labor takes up the... Read More
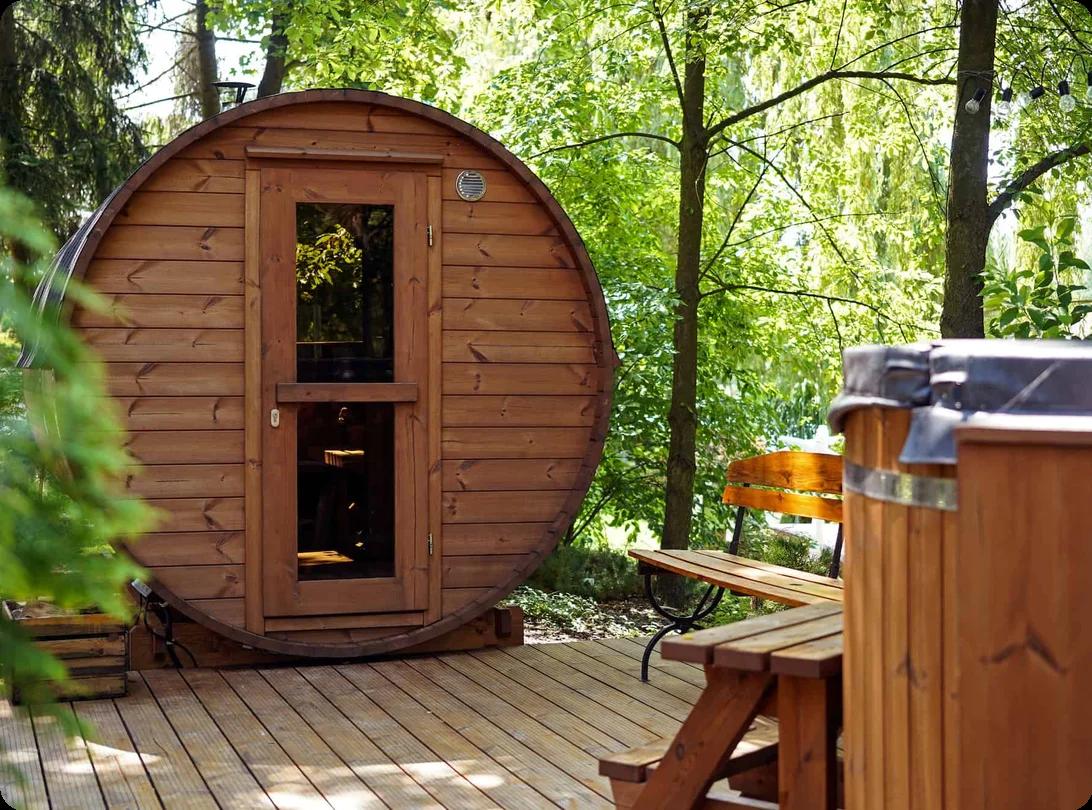
Figuring out how to move a sauna can feel pretty daunting when you’re looking at such a heavy wooden structure with multiple parts attached to it. However, moving a sauna simply requires disassembling it in reverse... Read More

You might think shoes are easier to pack than glassware or your TV, but if you just throw them into a large bag without following the proper steps, you might end up with scuffed leather, bent heels, or a moldy pair... Read More
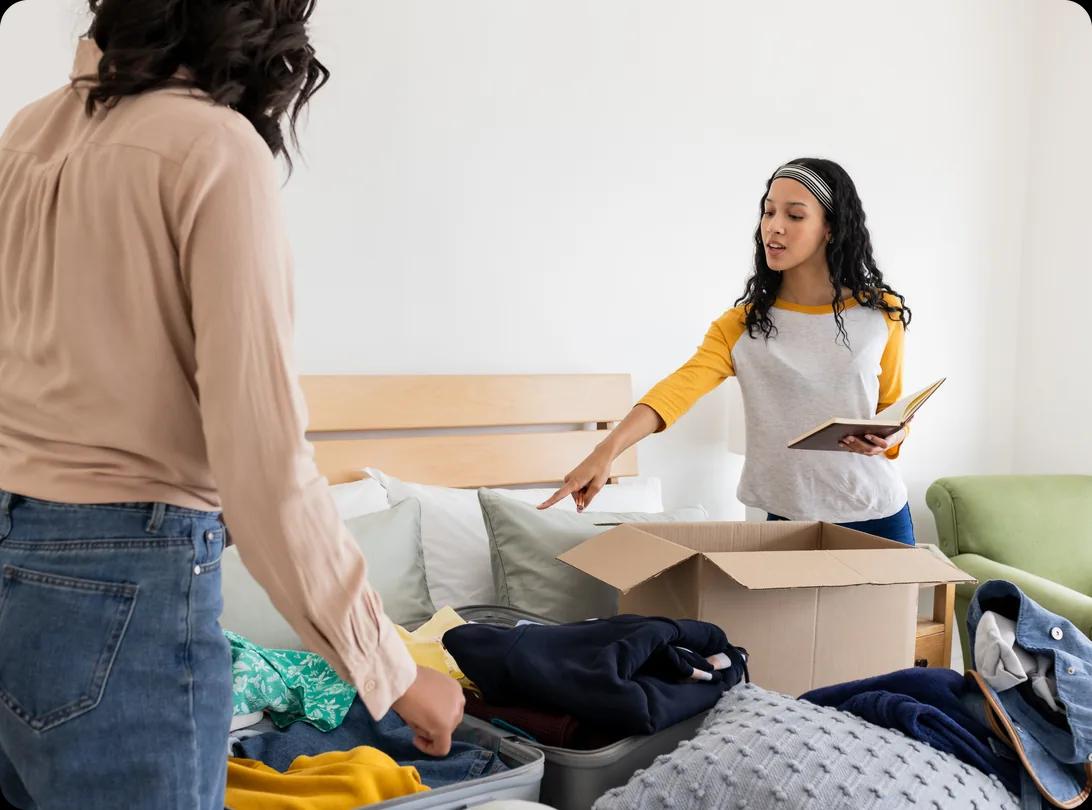
The easiest way to decide what makes the move to your new home and what stays behind is to follow this rule: If it costs more to move an item than it does to replace it, sell or donate it. For all other items, you... Read More

Moving after retirement can be a chance to start fresh, save money, and spend more time with the people you love. But it isn’t the right choice for everyone, so just like any other move, it’s worth making a plan... Read More

The best places to live for outdoor families include Boulder, CO; Bend, OR; Boise, ID; Salt Lake City, UT; Asheville, NC; and Burlington, VT. These spots have stable economies, strong public school systems, and... Read More

Looking over a moving estimate can feel overwhelming and confusing, especially when you're worried about surprise fees or extra weight that could increase your budget. To read a moving estimate, confirm the type of... Read More