Moving in the Year of Pandemic:
The 2020-2021 HireAHelper American Migration Report
From the beginning of a viral pandemic in the spring, to civil unrest in the summer, to election drama in the fall, 2020 has been historically difficult… and yet, statistically fascinating.
Data shows that by several accounts, 2020 has somehow been a year of growth in several markets. S&P 500 hit a historic high in September, eCommerce sales jumped by nearly a third, and home sales are on track to exceed the previous year's numbers.
All of which is to say, despite all the unpredictability of 2020, Americans kept going, or, in our case, kept moving.
Where did Americans move in the year of the pandemic? Which states and cities were they most drawn to in 2020? Which areas of the country were they most likely to leave? Was anything different about how, when and where Americans moved this past year?
HireAHelper analyzed over 75,000 moves booked with HireAHelper.com and our partners last year to paint a picture of how Americans moved in 2020.
Key Findings From 2020 Moving Data
COVID-19 Specific Findings:
- A quarter (25%) of Americans who moved in 2020 did it because of the pandemic
- Around 35% of COVID-forced moves were out of financial hardship
- Nearly one-third of those who moved because of COVID did so to look after family
- As the pandemic hit in the spring and summer, 30% more Americans moved in the fall than in the year before
Newest Moving Trends:
- Idaho was the top destination state with twice as many people moving in than out
- Five out of 10 top destination cities were in Florida, four on the Gulf Coast
- 68% more people left New York City in 2020 than moved into it
- In 2020, an average move was 13.7 miles farther than the year before
- Downsizing? The average square footage of the move was 282 square feet smaller last year than in 2019


Seeking Safety, Saving Money, Supporting Family: How COVID-19 Forced Americans to Move in 2020
To better understand the reasons behind moves Americans made last year, we sampled 4,000 of our customers about what made them move when they did.
When we first reported on moving during the COVID-19 pandemic in July of 2020, respondents reported an estimated 15% of the moves during this period were forced by the pandemic. By the end of the year, that share reached 25%.
In other words, a quarter of American moves in 2020 were in some part due to the pandemic.
Here are the results of the COVID-19 moving survey:
- A total of 36% of respondents moved to somewhere where they felt safer, i.e., somewhere with fewer COVID-19 cases, or more restrictions
- 35% were forced to move due to loss of job or income due to COVID-19
- 31% moved to either shelter-in-place with family or to take care of family members
- 28% moved because they started working from home and no longer had to live close to work
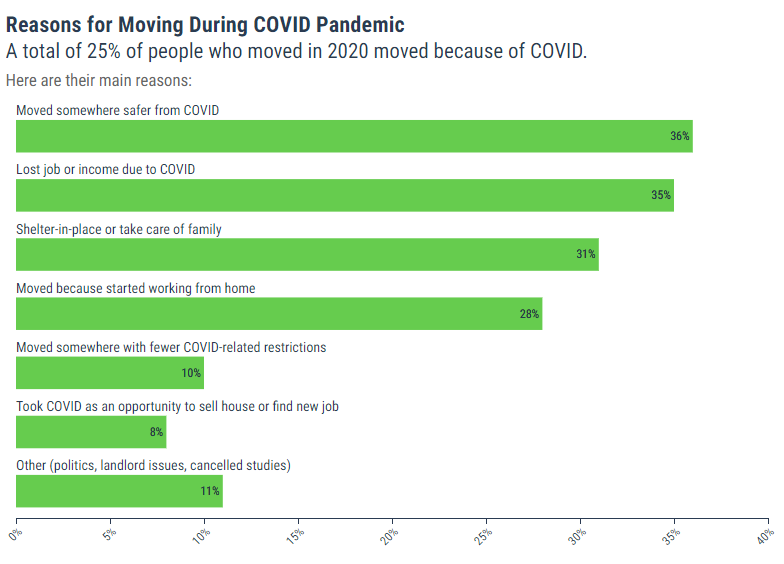
However, not everyone was keen to seek safety in places with tight COVID-related restrictions. Concerningly, as many as 10% of people deliberately moved somewhere where lockdowns weren't as tight and the schools were open.
Around 3% of Americans whose moves were forced by the pandemic had to move to a bigger place to enable them to either work from home or keep kids at home while schools were closed.
Elsewhere, 2% of people whose move in 2020 was forced by the pandemic had to move because of issues with their landlord. In most such cases, this was due to landlords having to sell their property after their own COVID-related financial hardship.
... a quarter of American moves in 2020 were in some part due to the pandemic.
The Pace of Pandemic Moves
When we first wrote about moving during the COVID-19 pandemic in July last year, we saw (or wanted to see) the pandemic as temporary. As it turned out, the pandemic went on to make an impact on how Americans moved all year long.
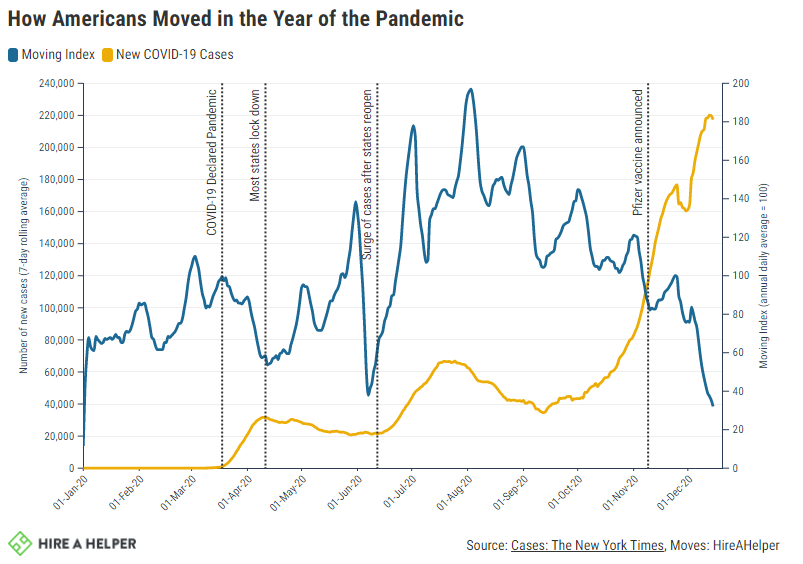
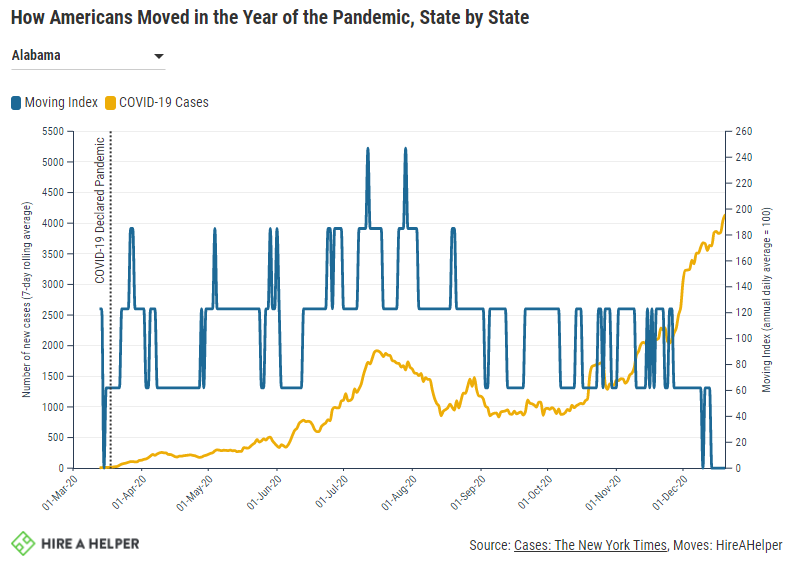
As we all know, the COVID pandemic affected different parts of the US differently. Washington State and New York City were hit hard earlier in the year, Arizona and Texas had their first peaks in the summer, while Minnesota, the Dakotas started seeing their cases skyrocket towards the end of the year.
Concerningly, as many as 10% of people deliberately moved somewhere where lockdowns weren't as tight and the schools were open.
How did these developments affect moving in these states? Check our interactive graph below, where you can see how the number of people moving changed with the number of COVID cases, state by state.

Out of California and Into Idaho: Where Americans Moved in 2020
Whether it was business as usual, or because of the pandemic, more Americans moved in 2020 than in 2019, according to our data.
Throughout the year, we've seen news of newly-remote workers leaving big cities in droves, reports of students relocating back home as colleges went online, and stories about Americans moving to a different city to wait out the pandemic.
How have all these trends shaped the ebbs and moving in America in 2020? Where were these moves headed? While we can't claim knowledge of all the moves that took place last year, we certainly have a strong pulse on the latest American migration patterns.
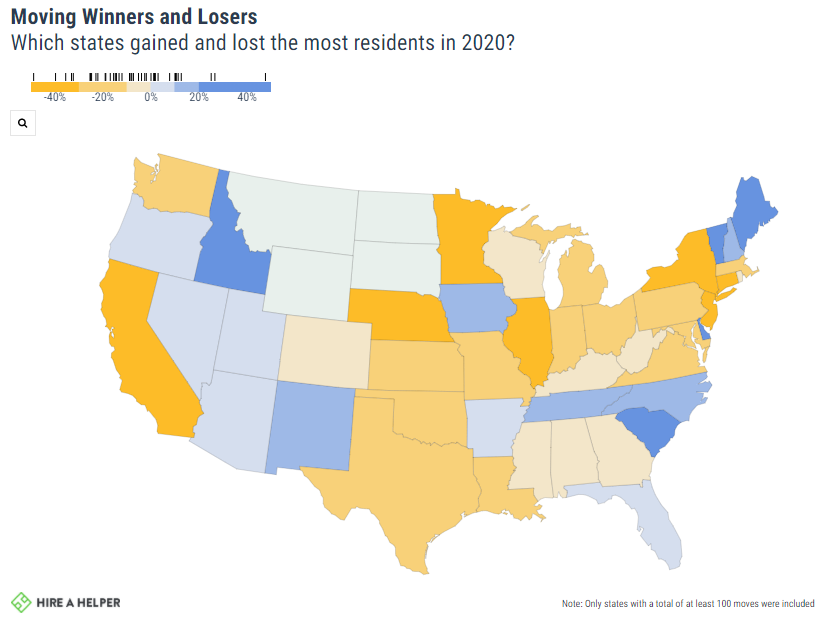
Idyllic Idaho Wins Out, New England States Not Far Behind
Sure, if we looked at purely the number of people moving in, the table would look quite different and favor the bigger states like Florida, Texas, and California, which attract higher volumes of people than, say, Idaho or Vermont.
However, adding the number of outgoing moves into the equation lets us get the idea of which states gain the most new residents. Pandemic or not, the appeal of Idaho seems unwavering. In 2019, 49% more people moved into The Gem State than moved out of it. In 2020, that figure was at 103%, meaning twice as many people moved to Idaho than left it, higher than any other state.
Not only is this figure higher than for any other state, but the two states that came closest - Vermont and New Hampshire - were significantly behind Idaho, with 62% and 47% more people moving in than out, respectively.
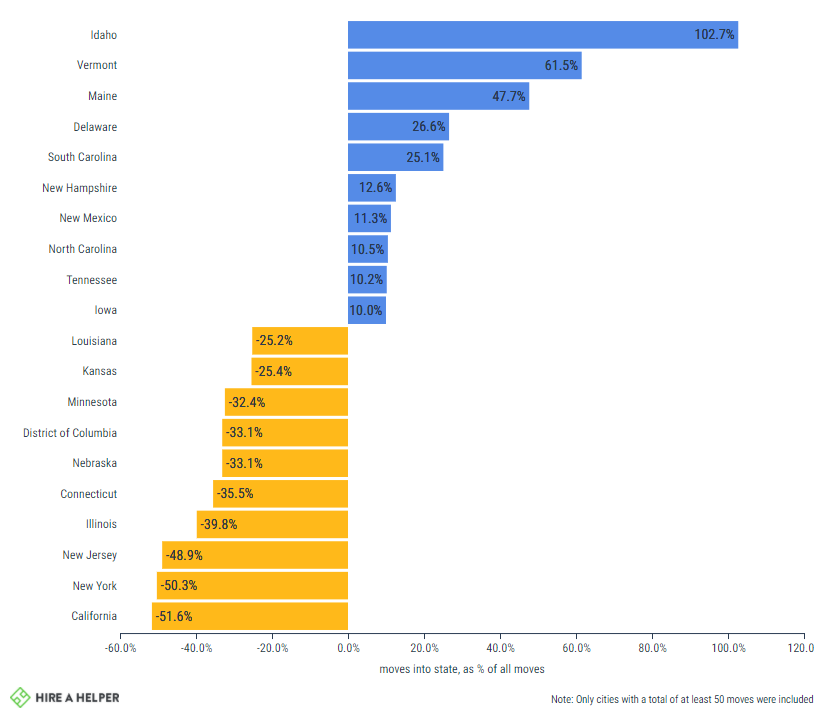
On the opposite side of the scale, no surprises. Americans continue to leave states burdened by significant tax burdens, higher cost of living, and ever-expanding cities.
Consistent with our last year's findings, California (-51%), New York (-50%), New Jersey (-40%), and Illinois (-37%) all lost more people than they gained from moving in 2020.
To see how the rest of the states fared, check our handy map below.


Which Cities Did People Move to and Leave in 2020?
|
Net Winners
|
Net Moves
|
|---|---|
| Boise, ID | +300% |
| Venice, FL | +292% |
| Georgetown, TX | +213% |
| Goodyear, AZ | +135% |
| Sarasota, FL | +126% |
| Cape Coral, FL | +103% |
| Simpsonville, SC | +94% |
| Punta Gorda, FL | +76% |
| Saint Augustine, FL | +75% |
| Buckeye, AZ | +75% |
|
Net Losers
|
Net Moves
|
|---|---|
| New York, NY | -68% |
| Oakland, CA | -66% |
| San Francisco, CA | -59% |
| Omaha, NE | -57% |
| Fort Lauderdale, FL | -55% |
| Jersey City, NJ | -53% |
| Los Angeles, CA | -51% |
| Cambridge, MA | -50% |
| San Jose, CA | -49% |
| Wichita, KS | -47% |
If some early 2020 reports were to be believed, the pandemic was supposed to herald "the death of the city", whereby many Americans, who all of sudden became able to and were forced to work from home, would move out to the country.
...twice as many people moved to Idaho than left it, higher than any other state.
That didn't quite happen. While many are keen on escaping the crushing costs of living in America's biggest cities like NYC or LA, they're simply going to smaller cities, which likely still afford them a similar level of comfort at a lower price point.
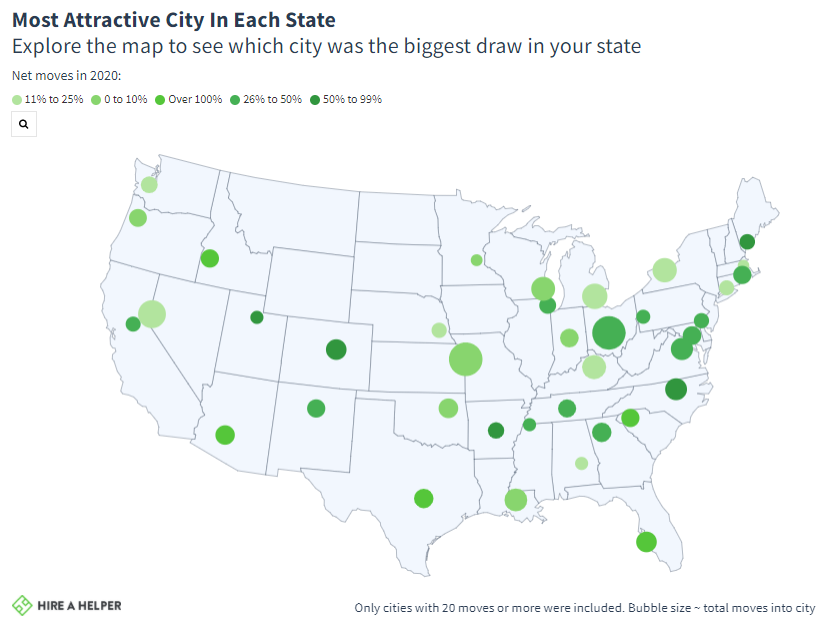
On top of the cities' chart for top moving destinations in 2020 is… Boise, Idaho! Four times as many people moved into Boise, ID than left it.
In past years, while Idaho had the highest net gains in terms of folks moving in, the moves were largely dispersed across the states' many towns and cities. This year, Boise, ID has put itself on the map.
Another remarkable thing about cities with the largest gains is that five of them are in Florida. The Sunshine state being a popular destination isn't exactly news, but what is peculiar is that four of those five cities are on Florida's Gulf Coast, away from the traditional destinations of Miami and West Palm Beach.
Unlike with the ranking of states, there are a few surprises on the list of cities that registered the biggest net losses with regards to people moving in and out.
Predictably, New York City came out as the biggest "loser" with 68% more people leaving the city than moving in. The usual suspects in California - San Francisco, Oakland, Los Angeles, San Jose - were all there, each having a net loss of around 50% in 2020.
Less predictably, however, are Omaha, NE (-57%) and Wichita, KS (-47%) being among the 10 cities that saw the greatest net losses of moving. Whether down to a relative lack of job opportunities for college grads or high unemployment, these two Midwestern cities are among those people were most likely to leave in 2020.
Check out which cities registered the greatest number of people moving in versus out on the map below.


Later, Smaller, Further? How Americans Moved in 2020
By now, we've already established that the course of the COVID pandemic affected where Americans moved in 2020. Where the impact was felt more profoundly, however, was in terms of how people moved, how far they went, and how large their moves were.
Delayed Relocation: How COVID-19 Shifted Peak Moving Months
With the pandemic and associated restrictions setting in, Americans seemed to have put their moving plans on hold.
While 11.7% of all moves we tracked in 2019 took place in June, only 8.2% of moves we recorded in 2020 took place during this month.
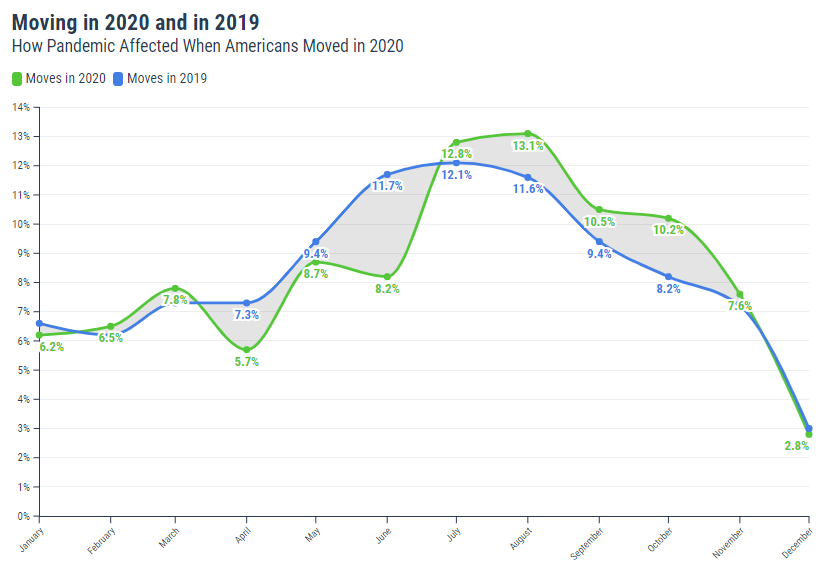
As a result, the peak moving month was shifted to August. Yet even more interestingly, Americans continued moving throughout the fall at unprecedented levels, as if they were just delaying their moves originally scheduled for the spring when the pandemic first hit.
Over 20% of all moves that took place in 2020 happened either in September or October - months where during a regular year the moving starts to slow down. In 2019, for example, only 17% moved during these two months.
Moving Light: How COVID-19 Pandemic Made Moves Smaller
In a rather unexpected turn of events, moves in 2020 were also significantly smaller in size than moves we recorded in 2019.
How do we know? The average square footage handled by movers in 2019 was at 1,877, but in 2020 that figure went down by 282 square feet, standing at 1,595 square feet.


Far Far Away: How COVID-19 Pandemic Made People Move Further
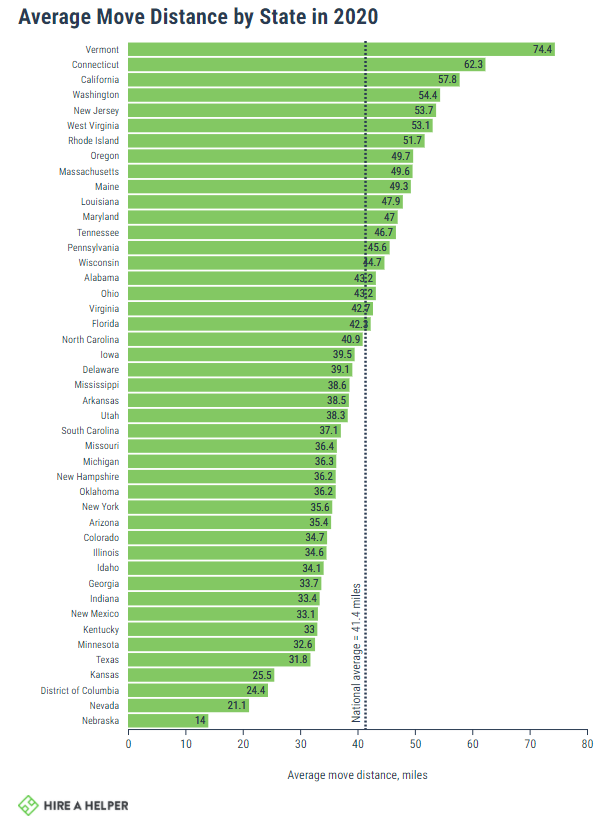
The vast majority of Americans who move do so locally. The moving industry statistics suggest that about 60% of people move within their county, 50% of all the moves are within 25 miles, and the average move distance is recorded at 27.7 miles in 2019.
Americans continued moving throughout the fall at unprecedented levels, as if they were just delaying their moves originally scheduled for the spring when the pandemic first hit.
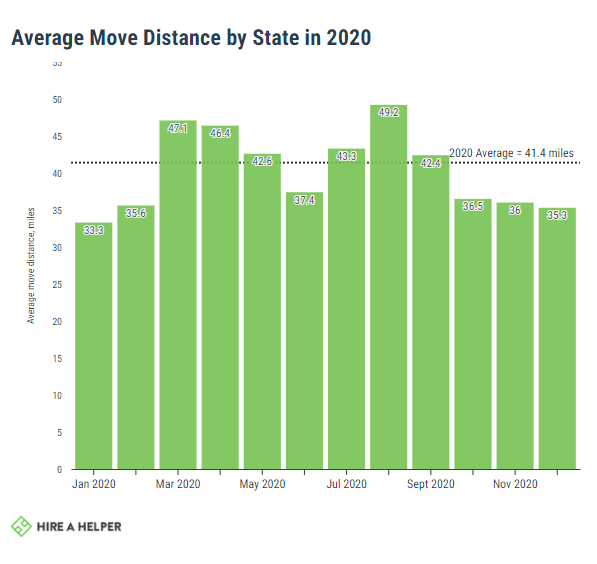
In 2020, that changed. The average distance for a move last year was 41.4 miles, almost 14 miles longer than in 2019.
The sharp rise in moving distance began in March and peaked in August, when the average distance for a move reached 49.2 miles.
Moving further away in 2020 was common across nearly all states, but the increase in moving distance was particularly drastic in Connecticut, Washington, California, Vermont, and Oregon. In all of these states, the average move in 2020 was at least 26 miles longer than in 2019.

Sources & Methodology
HireAHelper's COVID Moving Study analyzed local and long distance moving data in the US, booked through our online platform or sister sites in 2020. Six states: Alaska, Hawaii, Montana, North Dakota, South Dakota, and Wyoming were excluded due to a lack of sufficiently representative move data.
The start of the COVID-19 pandemic was taken from its official declaration as a pandemic on March 11th, 2020.
Unless otherwise stated, all percentages, breakdowns, and summary statistics were derived from the data captured by HireAHelper.com and our partner sites such as SimpleMovingLabor. Additional data sources include a HireAHelper user survey carried out in January 2021.
Net gains or losses in people moving in/out for both states and cities were calculated as the ratio of:
- # of people moving into the state or city, to
- the # of people moving out of the state or city
- expressed as a percentage (%)
States with less than 100 in- or out-moves were excluded. Cities with less than 50 in- or out-moves were excluded from the "Net Winners and Losers" calculation. Cities with less than 20 in- or out-moves were excluded from the "Most Attractive City in Each State".
A note on Census data: Unlike our previous reports, this one doesn't make use of US Census Bureau data on migration due to the data collection within the relevant census surveys reflecting a split-year, i.e., 2019-2020, and thus not likely being completely representative of the unique year that was 2020.
Illustrations by The Long Ly