Cities With the Highest Share of Income Going Towards Mortgage Payments
 Photo Credit: Alamy Stock Photo
October 7, 2020
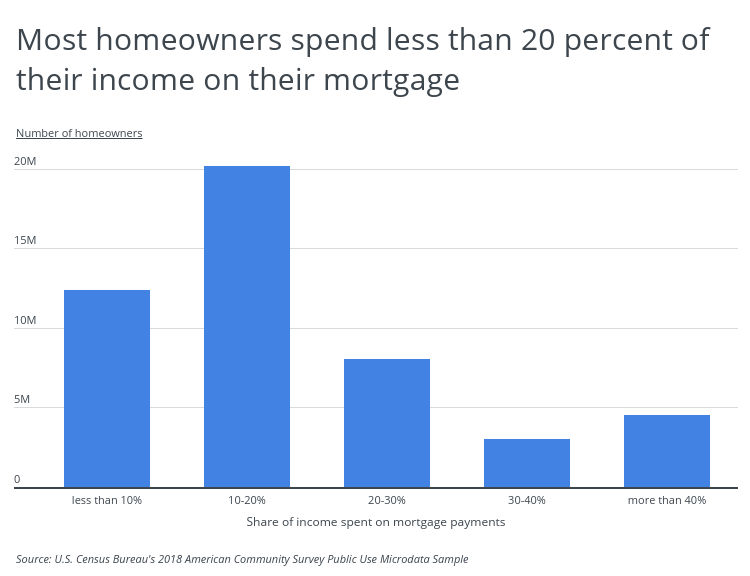
Housing is the largest expense for the average American household. Among homeowners with a mortgage, the median share of household income going towards mortgage payments alone—not including other household expenses such as utilities—is 14.9%, according to Census Bureau data. This figure varies substantially across the country, and many Americans spend a much larger proportion of their income on their mortgages. During economic downturns, these households are especially vulnerable.
While the majority of American homeowners put less than 20% of their income towards mortgage payments, over 7.5 million households spend 30% or more. Furthermore, 4.5 million households, or almost 10% of all households with a mortgage, allocate over 40% of their income to mortgage payments.
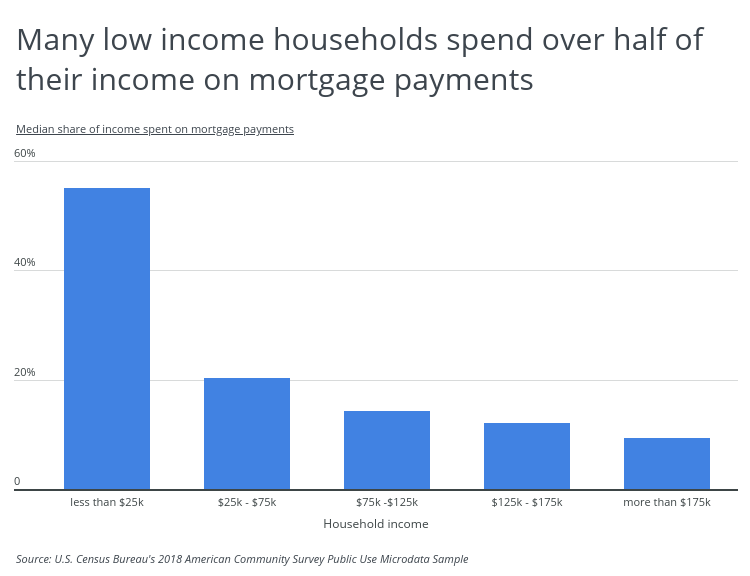
This trend is tightly correlated to household income, with lower income households more likely to spend a greater share of their income on their mortgage payment. Among households earning less than $25,000 (accounting for 7.2% of households with a mortgage), the median share of income going towards mortgage payments is 55%. This percentage declines steadily as household income increases, with households earning over $175,000 per year spending just 9.4%.
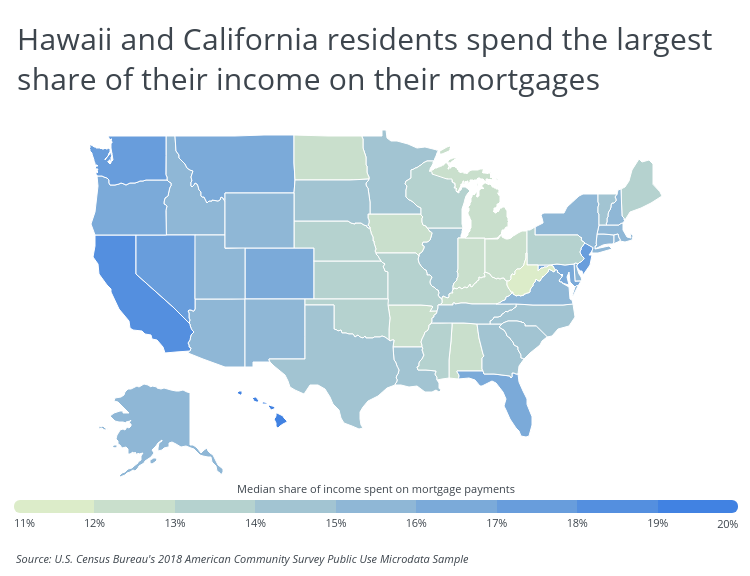
Because of the large geographic variation in home prices and earnings, housing costs as a percentage of income varies substantially across cities and states. In general, people living in coastal states tend to spend a greater portion of their income on housing; whereas, those living in the Midwest spend less. Residents in Hawaii and California spend the most on their mortgages, at 19.2% and 18.4% of income, respectively. Residents of Indiana and West Virginia tend to spend much less, at 12.0% and 11.7% of income, respectively.
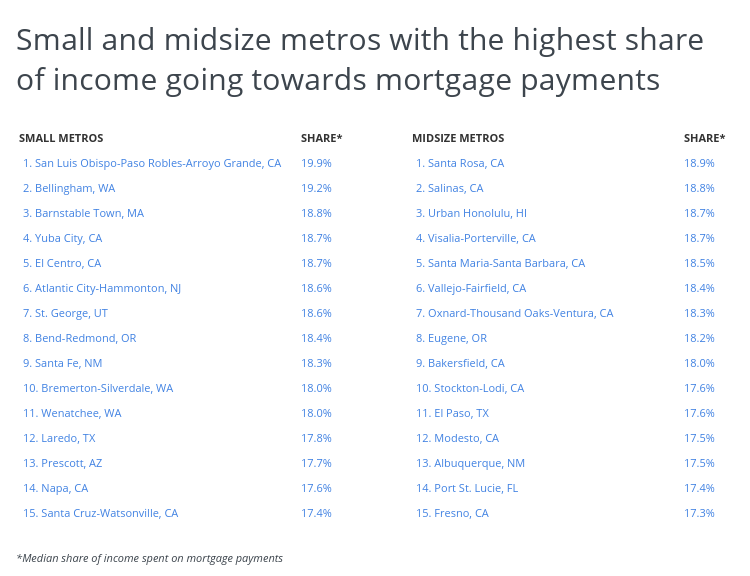
To find the metropolitan areas with the highest and lowest share of income going towards mortgage payments, researchers at HireAHelper, a marketplace for local moving companies, analyzed the latest data from the U.S. Census Bureau and Zillow. The researchers ranked metro areas according to the median share of income spent on mortgage payments. Researchers also calculated the median monthly mortgage payment, median monthly household income (for homeowners with a mortgage), and the Zillow Home Value Index—a measure of the typical home value in a region.
To improve relevance, only metropolitan areas with at least 100,000 people were included in the analysis. Additionally, metro areas were grouped into the following cohorts based on population size:
- Small metros: 100,000–349,999
- Midsize metros: 350,000–999,999
- Large metros: 1,000,000 or more
Here are the metropolitan areas with the highest and lowest share of income going towards mortgage payments.
Large Metros With the Highest Share of Income Going Towards Mortgage Payments
 Photo Credit: Alamy Stock Photo
1. Los Angeles-Long Beach-Anaheim, CA
- Median share of income spent on mortgage payments: 19.8%
- Median monthly mortgage payment: $1,900
- Median monthly household income: $9,500
- Zillow home value index $696,601
 Photo Credit: Alamy Stock Photo
2. Riverside-San Bernardino-Ontario, CA
- Median share of income spent on mortgage payments: 19.6%
- Median monthly mortgage payment: $1,500
- Median monthly household income: $7,529
- Zillow home value index $395,370
 Photo Credit: Alamy Stock Photo
3. San Diego-Carlsbad, CA
- Median share of income spent on mortgage payments: 19.2%
- Median monthly mortgage payment: $2,000
- Median monthly household income: $9,917
- Zillow home value index $639,238
 Photo Credit: Alamy Stock Photo
4. New York-Newark-Jersey City, NY-NJ-PA
- Median share of income spent on mortgage payments: 18.0%
- Median monthly mortgage payment: $2,000
- Median monthly household income: $10,668
- Zillow home value index $491,993
 Photo Credit: Alamy Stock Photo
5. Miami-Fort Lauderdale-West Palm Beach, FL
- Median share of income spent on mortgage payments: 18.0%
- Median monthly mortgage payment: $1,300
- Median monthly household income: $7,000
- Zillow home value index $308,522
 Photo Credit: Alamy Stock Photo
6. Sacramento-Roseville-Arden-Arcade, CA
- Median share of income spent on mortgage payments: 17.8%
- Median monthly mortgage payment: $1,600
- Median monthly household income: $8,842
- Zillow home value index $439,664
 Photo Credit: Alamy Stock Photo
7. Seattle-Tacoma-Bellevue, WA
- Median share of income spent on mortgage payments: 17.4%
- Median monthly mortgage payment: $1,800
- Median monthly household income: $10,242
- Zillow home value index $551,311
 Photo Credit: Alamy Stock Photo
8. Las Vegas-Henderson-Paradise, NV
- Median share of income spent on mortgage payments: 17.3%
- Median monthly mortgage payment: $1,200
- Median monthly household income: $7,000
- Zillow home value index $298,275
 Photo Credit: Alamy Stock Photo
9. Virginia Beach-Norfolk-Newport News, VA-NC
- Median share of income spent on mortgage payments: 17.0%
- Median monthly mortgage payment: $1,300
- Median monthly household income: $7,575
- Zillow home value index $250,878
 Photo Credit: Alamy Stock Photo
10. Portland-Vancouver-Hillsboro, OR-WA
- Median share of income spent on mortgage payments: 16.7%
- Median monthly mortgage payment: $1,500
- Median monthly household income: $8,908
- Zillow home value index $425,758
Large Metros With the Lowest Share of Income Going Towards Mortgage Payments
 Photo Credit: Alamy Stock Photo
1. Pittsburgh, PA
- Median share of income spent on mortgage payments: 12.0%
- Median monthly mortgage payment: $900
- Median monthly household income: $7,500
- Zillow home value index $165,002
 Photo Credit: Alamy Stock Photo
2. Buffalo-Cheektowaga-Niagara Falls, NY
- Median share of income spent on mortgage payments: 12.1%
- Median monthly mortgage payment: $910
- Median monthly household income: $7,417
- Zillow home value index $179,947
 Photo Credit: Alamy Stock Photo
3. Indianapolis-Carmel-Anderson, IN
- Median share of income spent on mortgage payments: 12.6%
- Median monthly mortgage payment: $900
- Median monthly household income: $7,167
- Zillow home value index $191,069
 Photo Credit: Alamy Stock Photo
4. Cleveland-Elyria, OH
- Median share of income spent on mortgage payments: 12.8%
- Median monthly mortgage payment: $930
- Median monthly household income: $7,189
- Zillow home value index $166,325
 Photo Credit: Alamy Stock Photo
5. Rochester, NY
- Median share of income spent on mortgage payments: 12.9%
- Median monthly mortgage payment: $900
- Median monthly household income: $7,333
- Zillow home value index $165,251
 Photo Credit: Alamy Stock Photo
6. Grand Rapids-Wyoming, MI
- Median share of income spent on mortgage payments: 12.9%
- Median monthly mortgage payment: $930
- Median monthly household income: $7,333
- Zillow home value index $228,389
 Photo Credit: Alamy Stock Photo
7. Cincinnati, OH-KY-IN
- Median share of income spent on mortgage payments: 12.9%
- Median monthly mortgage payment: $970
- Median monthly household income: $7,558
- Zillow home value index $195,109
 Photo Credit: Alamy Stock Photo
8. Detroit-Warren-Dearborn, MI
- Median share of income spent on mortgage payments: 13.1%
- Median monthly mortgage payment: $990
- Median monthly household income: $7,542
- Zillow home value index $186,913
 Photo Credit: Alamy Stock Photo
9. Louisville/Jefferson County, KY-IN
- Median share of income spent on mortgage payments: 13.2%
- Median monthly mortgage payment: $900
- Median monthly household income: $7,083
- Zillow home value index $187,443
 Photo Credit: Alamy Stock Photo
10. St. Louis, MO-IL
- Median share of income spent on mortgage payments: 13.2%
- Median monthly mortgage payment: $1,000
- Median monthly household income: $7,583
- Zillow home value index $186,055
Detailed Findings & Methodology
A significant number of metros with the highest share of income going towards mortgage payments are located in California, a state known for its expensive housing. Most of the other metros with high shares are also on the coasts. Among all metros with the highest share of income going towards mortgages, home values average over $400,000. In comparison, the average home value for large metros with the lowest share of income spent on mortgages is just $185,000.
Lower income families are not only more likely to allocate a large share of their income to housing, but they have also been disproportionately impacted by the COVID-19 pandemic. A majority of lower income adults say that they or a household member has experienced a job loss or a pay cut due to the pandemic and resulting economic downturn. If these households were already stretching their budgets to cover mortgage payments, they face even more pressure now.
To determine the metros with the highest and lowest share of income going towards mortgage payments, researchers at HireAHelper analyzed the latest data from the U.S. Census Bureau's 2018 American Community Survey Public Use Microdata Sample (ACS PUMS) and the Zillow Home Value Index. The researchers ranked metro areas according to the median share of income spent on mortgage payments. In the event of a tie, the metro with the higher median monthly mortgage payment was ranked higher. Researchers also included median monthly household income (for homeowners with a mortgage) and the Zillow Home Value Index for July 2020—a measure of the typical home value in a region.
Only metropolitan areas with at least 100,000 people were included in the analysis. Additionally, metro areas were grouped into the following cohorts based on population size:
- Small metros: 100,000–349,999
- Midsize metros: 350,000–999,999
- Large metros: 1,000,000 or more