Most Popular Affordable Cities for Retirees
 Photo Credit: shurkin_son / Shutterstock
December 19th, 2022
Inflation in the U.S. is starting to show signs of cooling after reaching historic heights over the last year and a half. This is good news for almost every U.S. household, but especially for the more than 55 million Americans at retirement age or older.
Unlike many working-age adults, who are leveraging a tight labor market to secure higher wages that outpace inflation, retirees often rely on investment accounts like 401ks or IRAs and fixed income like pensions or Social Security. But stock market returns have fallen over the last year, and fixed income programs often do not adjust payments quickly enough to account for inflation.
The Social Security Administration recently announced that the program's beneficiaries will receive an 8.7% cost of living adjustment in 2023. The increase in benefit payouts comes after a 5.9% cost of living adjustment in 2022, which was the highest since the 1980s. But despite these aggressive increases, critics have argued the adjustments are insufficient given the pace of inflation and the high number of retirees who rely entirely or almost entirely on Social Security.
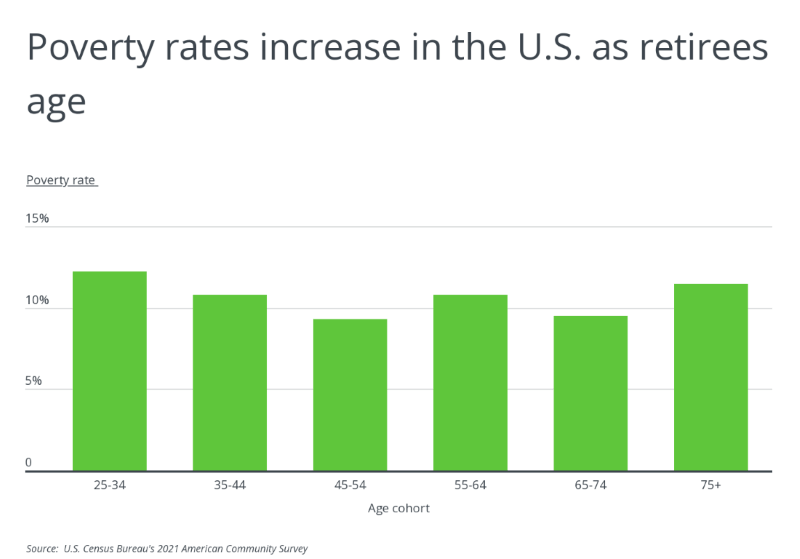
Rising cost of living and reliance on fixed income threatens to push higher shares of elderly Americans into poverty. Essential categories like food and housing have seen the highest rates of inflation since 2021, which can quickly eat into household budgets. Elderly people are also more likely to face medical issues that could add to their expenses. As a result of these factors, 11.5% of Americans aged 75 and over have incomes below the U.S. poverty level, the second highest of any age cohort. And according to Census data, elderly Americans were the only age group to see an increase in the share living in poverty from 2020 to 2021.
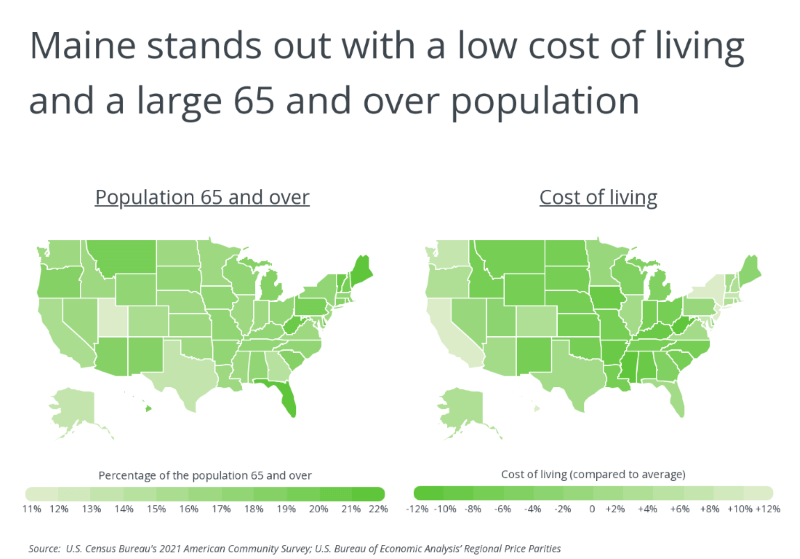
While inflation and economic insecurity for the elderly are nationwide concerns, some parts of the U.S. host larger populations of older Americans while keeping cost of living relatively low. For example, Maine has the nation's largest population share aged 65 and over at 21.7% but has a cost of living 3.2% below the national average, while West Virginia has a 20.7% elderly population and cost of living 12% below the national average. And cost of living may be a driver for where older people are choosing to move: eight of the top 10 states for net migration of the 65 and over population offer below-average living costs.
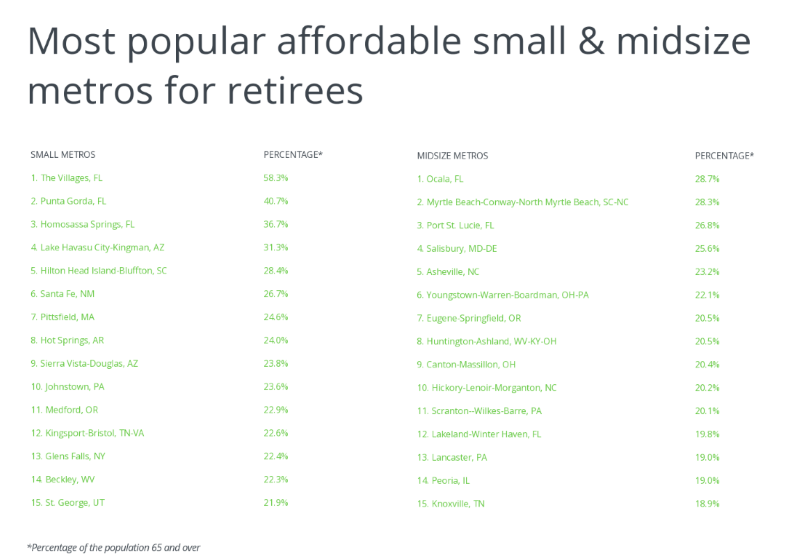
At the local level, cities across the country offer the same combination of popularity with retirees and affordable living. Many of the top affordable cities for retirees are found in fast-growing Sun Belt locations like Tucson and Tampa, but other top locations include highly affordable Midwestern and Mid-Atlantic cities including Pittsburgh, Cleveland, and Buffalo.
The data used in this analysis is from the U.S. Census Bureau, U.S. Bureau of Economic Analysis, and Zillow. To determine the most popular affordable locations for retirees, researchers at HireAHelper first identified all locations with below-average cost of living, and then calculated the percentage of the population 65 and over. In the event of a tie, the location with the greater total population 65 and over was ranked higher.
Here are the most popular affordable U.S. metropolitan areas for retirees.
Most Popular Affordable Large Metros for Retirees
 Photo Credit: doma / Shutterstock
15. Cincinnati, OH-KY-IN
- Percentage of the population 65 and over: 15.9%
- Total population 65 and over: 360,394
- Cost of living (compared to average): -6.5%
- Median home price: $264,110
 Photo Credit: Sean Pavone / Shutterstock
14. Tulsa, OK
- Percentage of the population 65 and over: 16.1%
- Total population 65 and over: 164,435
- Cost of living (compared to average): -7.1%
- Median home price: $217,054
 Photo Credit: Sean Pavone / Shutterstock
13. Milwaukee-Waukesha, WI
- Percentage of the population 65 and over: 16.5%
- Total population 65 and over: 258,407
- Cost of living (compared to average): -4.1%
- Median home price: $268,653
 Photo Credit: Sean Pavone / Shutterstock
12. Richmond, VA
- Percentage of the population 65 and over: 16.6%
- Total population 65 and over: 219,271
- Cost of living (compared to average): -4.6%
- Median home price: $342,146
 Photo Credit: Sean Pavone / Shutterstock
11. Birmingham-Hoover, AL
- Percentage of the population 65 and over: 16.7%
- Total population 65 and over: 186,612
- Cost of living (compared to average): -7.4%
- Median home price: $249,754
 Photo Credit: CHARLES MORRA / Shutterstock
10. Jacksonville, FL
- Percentage of the population 65 and over: 16.8%
- Total population 65 and over: 274,814
- Cost of living (compared to average): -3.7%
- Median home price: $379,425
 Photo Credit: Sean Pavone / Shutterstock
9. New Orleans-Metairie, LA
- Percentage of the population 65 and over: 17.3%
- Total population 65 and over: 218,184
- Cost of living (compared to average): -3.1%
- Median home price: $271,024
 Photo Credit: Sean Pavone / Shutterstock
8. Detroit-Warren-Dearborn, MI
- Percentage of the population 65 and over: 17.3%
- Total population 65 and over: 756,935
- Cost of living (compared to average): -2.9%
- Median home price: $239,519
 Photo Credit: picsbyst / Shutterstock
7. St. Louis, MO-IL
- Percentage of the population 65 and over: 17.6%
- Total population 65 and over: 492,646
- Cost of living (compared to average): -4.3%
- Median home price: $243,975
 Photo Credit: Andrew Zarivny / Shutterstock
6. Rochester, NY
- Percentage of the population 65 and over: 19.0%
- Total population 65 and over: 206,622
- Cost of living (compared to average): -1.7%
- Median home price: $218,418
 Photo Credit: Daniel Novak / Shutterstock
5. Buffalo-Cheektowaga, NY
- Percentage of the population 65 and over: 19.1%
- Total population 65 and over: 221,893
- Cost of living (compared to average): -4.3%
- Median home price: $246,218
 Photo Credit: f11photo / Shutterstock
4. Cleveland-Elyria, OH
- Percentage of the population 65 and over: 19.4%
- Total population 65 and over: 402,285
- Cost of living (compared to average): -7.0%
- Median home price: $219,942
 Photo Credit: Sean Pavone / Shutterstock
3. Tampa-St. Petersburg-Clearwater, FL
- Percentage of the population 65 and over: 20.2%
- Total population 65 and over: 649,159
- Cost of living (compared to average): -0.9%
- Median home price: $390,811
 Photo Credit: John D Sirlin / Shutterstock
2. Tucson, AZ
- Percentage of the population 65 and over: 20.7%
- Total population 65 and over: 217,439
- Cost of living (compared to average): -6.2%
- Median home price: $344,547
 Photo Credit: f11photo / Shutterstock
1. Pittsburgh, PA
- Percentage of the population 65 and over: 20.8%
- Total population 65 and over: 490,296
- Cost of living (compared to average): -4.3%
- Median home price: $209,887
Detailed Findings & Methodology
The data used in this analysis is from the U.S. Census Bureau's 2021 American Community Survey, the U.S. Bureau of Economic Analysis' Regional Price Parities, and Zillow's Housing Data. To determine the most popular affordable locations for retirees, researchers at HireAHelper calculated the percentage of the population 65 and over. In the event of a tie, the location with the greater total population 65 and over was ranked higher. To improve relevance, only metropolitan areas with at least 100,000 residents were included. Additionally, metros were grouped into cohorts based on population size: small (100,000–349,999), midsize (350,000–999,999), and large (1,000,000 or more). Note, only locations with a cost-of-living below the national average were considered in this analysis.