States Spending the Most on Affordable Housing & Community Development
 Photo Credit: PIXEL to the PEOPLE / Shutterstock
October 13th, 2021
The COVID-19 pandemic has placed many stresses on low and middle-income families, and one of the most noteworthy is housing affordability.
Supply chain breakdowns have slowed new housing construction, the market for homebuyers is one of the most competitive in memory, and rents nationwide have increased by 13.8% since January 2021. Even as these trends continue to worsen, federal COVID-19 emergency relief measures have expired, including income supports like expanded unemployment benefits and housing policies like mortgage forbearance and the federal eviction moratorium.
While the pandemic has exacerbated housing issues, the affordable housing crisis is not a new problem. According to the National Low Income Housing Coalition, the U.S. has a shortage of nearly 7 million affordable homes, while 70% of low-income families are severely cost-burdened by housing, which means that they spend more than half of their income on rent.
Over the years, federal, state, and local governments have carved out an important role in addressing these challenges through public investments in housing and community development. Generally allocated towards residents not adequately served by the private sector, government housing and community development expenditures include the construction and operation of housing projects, along with other activities to promote or aid housing and community development. These other activities can include public housing, rental assistance like the Section 8 program, and community development or revitalization projects. Many of these programs are distributed from the federal government as grants for state and local governments to spend.
Massachusetts leads the nation in both housing and community development spending per capita…
Housing and community development is a relatively small spending category for most state and local budgets, but spending in this area has consistently grown at a faster rate than spending overall. Inflation-adjusted expenditures for housing and community development are up nearly 300% since 1977, even after accounting for an uptick in spending during the early 2000s and an eventual post-Great Recession reduction beginning in 2011. Total spending has only increased by 190% during the same period.
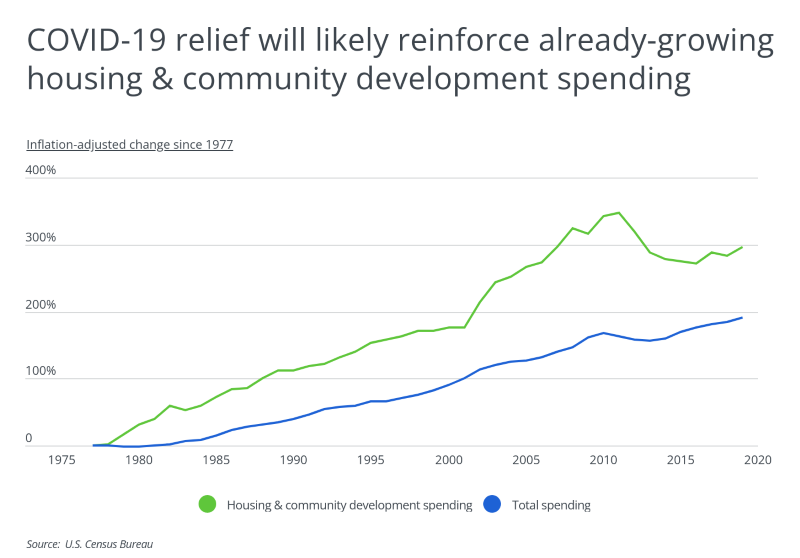
One factor that is likely to contribute to continued growth in the next few years is federal COVID-19 relief dollars targeted toward housing and community development. The Coronavirus Aid, Relief, and Economic Security (CARES) Act from March 2020, the Coronavirus Response and Relief Supplemental Appropriations Act from December 2020, and the American Rescue Plan Act from March 2021 all distributed funds to states and localities to help ensure people would be able to maintain access to housing during the pandemic and ensuing recession. This means that future data will show higher expenditures for housing and community development in 2020 and 2021. And with aggressive proposals to support low and middle-income families being a key part of the Biden Administration's agenda, states could continue to see increased federal investment in this area into the future.
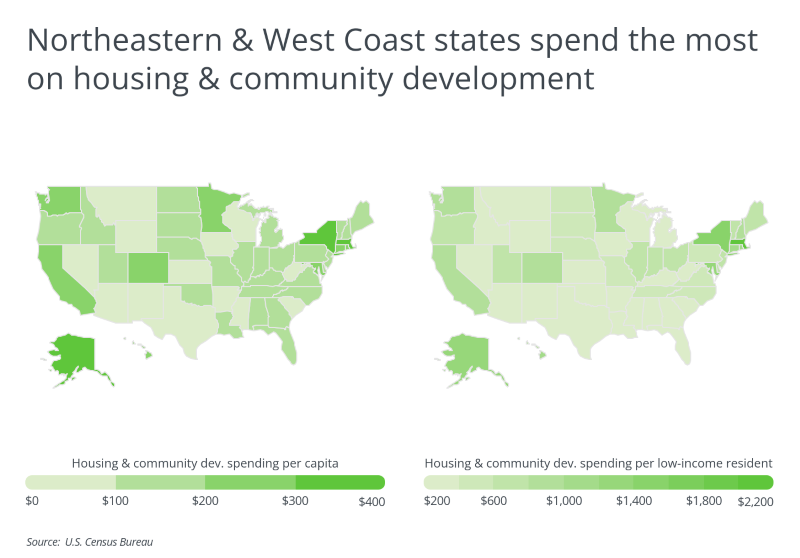
States vary significantly in how much they spend to support housing and community development. Massachusetts leads the nation in both housing and community development spending per capita at $432 and in spending per low-income resident, defined as those with incomes below 200% of poverty level, at $2,144. Most of the other leading states are located in the Northeast or on the West Coast. One reason why these states may be investing more in housing and community development is that housing in these locations tends to be less affordable, which means that government support is necessary to help increase the supply of housing and provide assistance so that lower-income residents can access it.
...with aggressive proposals to support low and middle-income families being a key part of the Biden Administration's agenda, states could continue to see increased federal investment in this area into the future.
The data used in this analysis is from the U.S. Census Bureau's "Annual Survey of State and Local Government Finances" report and the U.S. Census Bureau's "American Community Survey 1-Year Estimates" report. To determine the states spending most on housing and community development, researchers at HireAHelper calculated state and local housing and community development spending per capita. In the event of a tie, the state with the greater amount of housing and community development spending per low-income resident was ranked higher. Researchers also included total annual housing and community development spending, as well as its share of total state and local government spending.
Here are the states spending the most on housing and community development.
U.S. States Spending the Most on Housing & Community Development
 Photo Credit: Jon Bilous / Shutterstock
15. Delaware
- Housing & community dev. spending per capita: $175
- Housing & community dev. spending per low-income resident: $727
- Total annual housing & community dev. spending: $172,374,000
- Housing & community dev. spending share of total spending: 1.34%
 Photo Credit: Sean Pavone / Shutterstock
14. Indiana
- Housing & community dev. spending per capita: $175
- Housing & community dev. spending per low-income resident: $605
- Total annual housing & community dev. spending: $1,180,657,000
- Housing & community dev. spending share of total spending: 1.82%
 Photo Credit: Agnieszka Gaul / Shutterstock
13. Ohio
- Housing & community dev. spending per capita: $181
- Housing & community dev. spending per low-income resident: $623
- Total annual housing & community dev. spending: $2,120,535,000
- Housing & community dev. spending share of total spending: 1.56%
 Photo Credit: Sean Pavone / Shutterstock
12. Maine
- Housing & community dev. spending per capita: $194
- Housing & community dev. spending per low-income resident: $726
- Total annual housing & community dev. spending: $261,850,000
- Housing & community dev. spending share of total spending: 1.90%
 Photo Credit: Nicholas Courtney / Shutterstock
11. Colorado
- Housing & community dev. spending per capita: $200
- Housing & community dev. spending per low-income resident: $889
- Total annual housing & community dev. spending: $1,161,822,000
- Housing & community dev. spending share of total spending: 1.75%
 Photo Credit: Checubus / Shutterstock
10. Minnesota
- Housing & community dev. spending per capita: $203
- Housing & community dev. spending per low-income resident: $952
- Total annual housing & community dev. spending: $1,147,562,000
- Housing & community dev. spending share of total spending: 1.59%
 Photo Credit: Jon Bilous / Shutterstock
9. Washington
- Housing & community dev. spending per capita: $205
- Housing & community dev. spending per low-income resident: $899
- Total annual housing & community dev. spending: $1,576,691,000
- Housing & community dev. spending share of total spending: 1.56%
 Photo Credit: Sean Pavone / Shutterstock
8. Connecticut
- Housing & community dev. spending per capita: $224
- Housing & community dev. spending per low-income resident: $1,010
- Total annual housing & community dev. spending: $797,831,000
- Housing & community dev. spending share of total spending: 1.85%
 Photo Credit: Feoktistoff / Shutterstock
7. California
- Housing & community dev. spending per capita: $226
- Housing & community dev. spending per low-income resident: $820
- Total annual housing & community dev. spending: $8,889,557,000
- Housing & community dev. spending share of total spending: 1.40%
 Photo Credit: Dave H. Fine / Shutterstock
6. Hawaii
- Housing & community dev. spending per capita: $231
- Housing & community dev. spending per low-income resident: $1,134
- Total annual housing & community dev. spending: $324,958,000
- Housing & community dev. spending share of total spending: 1.74%
 Photo Credit: Richard Cavalleri / Shutterstock
5. Rhode Island
- Housing & community dev. spending per capita: $261
- Housing & community dev. spending per low-income resident: $1,133
- Total annual housing & community dev. spending: $276,136,000
- Housing & community dev. spending share of total spending: 2.02%
 Photo Credit: ESB Professional / Shutterstock
4. Maryland
- Housing & community dev. spending per capita: $270
- Housing & community dev. spending per low-income resident: $1,330
- Total annual housing & community dev. spending: $1,636,680,000
- Housing & community dev. spending share of total spending: 2.17%
 Photo Credit: Joseph Sohm / Shutterstock
3. Alaska
- Housing & community dev. spending per capita: $320
- Housing & community dev. spending per low-income resident: $1,297
- Total annual housing & community dev. spending: $234,028,000
- Housing & community dev. spending share of total spending: 1.56%
 Photo Credit: Victor Moussa / Shutterstock
2. New York
- Housing & community dev. spending per capita: $418
- Housing & community dev. spending per low-income resident: $1,553
- Total annual housing & community dev. spending: $8,089,503,000
- Housing & community dev. spending share of total spending: 2.15%
 Photo Credit: ESB Professional / Shutterstock
1. Massachusetts
- Housing & community dev. spending per capita: $432
- Housing & community dev. spending per low-income resident: $2,144
- Total annual housing & community dev. spending: $2,977,726,000
- Housing & community dev. spending share of total spending: 3.02%
Detailed Findings & Methodology
The data used in this analysis is from the U.S. Census Bureau's "Annual Survey of State and Local Government Finances" report and the U.S. Census Bureau's "American Community Survey 1-Year Estimates" report. To determine the states spending most on housing and community development, researchers calculated housing and community development spending per capita. In the event of a tie, the state with the higher housing and community development spending per low-income resident was ranked higher. Housing and community development relates to construction and operation of housing and redevelopment projects, and other activities to promote or aid housing and community development. Low-income residents were defined as those with incomes below 200% of the poverty level.