The Cities With the Most First-time Home Buyers (and the Most Homes for Sale)
 Photo Credit: karamysh / Shutterstock
October 1st, 2021
Strong demand in the real estate market has been one of the major economic stories of the last year. The COVID-19 pandemic put a premium on living space, while strong savings rates and investment returns, aggressive government stimulus, and persistently low interest rates have put the conditions in place for more homebuyers to enter the real estate market. But this surge in demand has made the market highly competitive and driven home prices to record highs.
While demand in the current market is in many ways shaped by factors related to the pandemic, one of the other driving forces is demographics. The Millennial generation—those born between 1981 and 1996—recently surpassed Baby Boomers as the largest living generation in the U.S., with more than 72 million members. And at ages 25 to 40, Millennials are also in the prime age range for first and second-time home buying. According to a recent report from the National Association of Realtors, Millennials now represent 37% of homebuyers, the largest generational segment of the market.
But these prospective young homebuyers have been frustrated by record-low housing inventory up for sale. Many would-be sellers have held off on listing their current homes, valuing their own living space during COVID-19 and apprehensive about looking for their next home in an ultra-competitive market.
...Millennials now represent 37% of homebuyers, the largest generational segment of the market.
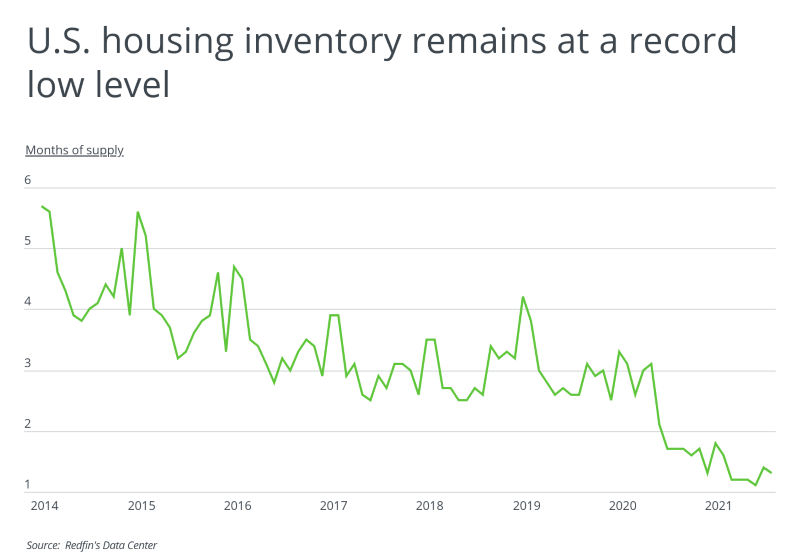
According to data from Redfin, the supply of homes for sale has been lower since the pandemic began than at any other point in recent years, reaching several new historic lows. The common measure for supply is months of inventory, which is calculated as inventory divided by home sales and estimates how long it would take current supply to be bought up if no new homes came on the market. That figure dipped below 2 months for the first time in July 2020 and has remained there since, reaching an all-time low of 1.1 months in June 2021.
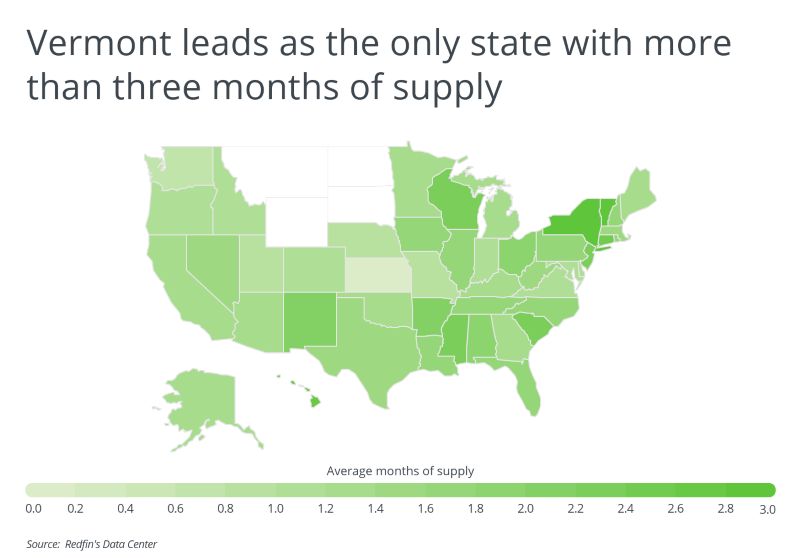
As Millennials seek out homes to buy, one interesting trend to watch is where homebuyers will choose to live. Some locations fare better than others in terms of supply, providing potential buyers with more options. Vermont has reported the greatest supply of homes in 2021 and is the only state to average more than 3 months of supply throughout the year. New York follows closely behind with an average of 2.8 months of supply. At the other end of the spectrum, Washington has the lowest supply at 0.7 months of inventory, while many of the other leading inventory-constrained states are Midwestern locales like Nebraska, Missouri, and Indiana.
Shifts in where young people buy homes may also affect urbanization patterns at the metro level. While college educated young professionals clustered heavily in urban centers during the 2010s, early indications are that Millennials are increasingly looking to the suburbs for more affordable homes and more living space as they establish families. But some cities—especially those that have experienced population declines in recent years—offer greater housing supply while allowing young people to enjoy the benefits of living near an urban core. These markets may prove to be desirable options for Millennial buyers.
...young homebuyers have been frustrated by record-low housing inventory up for sale.
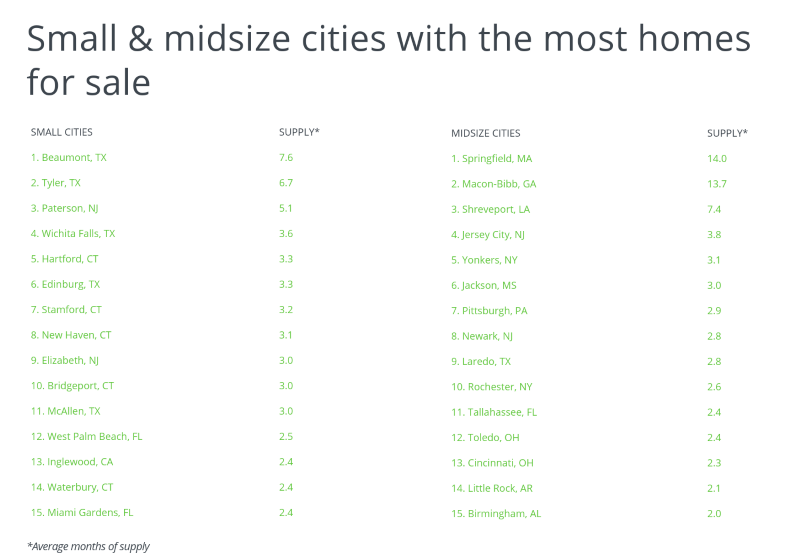
To determine the young cities with the most homes for sale, researchers at HireAHelper analyzed data from Redfin and the U.S. Census Bureau. HireAHelper only considered cities with median ages below the national median of 38.5 years, and then calculated the average months of supply for the year 2021. In the event of a tie, the city with more active listings per owner-occupied housing unit was ranked higher.
Here are the cities with the youngest home-buying populations and the most homes for sale.
Large Cities With the Most First-time Home Buyers and Homes for Sale
 Photo Credit: Sean Pavone / Shutterstock
15. Long Beach, CA
- Average months of supply: 1.7
- Average active listings per 10k homes: 147.1
- Average monthly active listings: 955
- Median sale price: $706,286
- Median age of population: 36.0
 Photo Credit: Sean Pavone / Shutterstock
14. El Paso, TX
- Average months of supply: 1.8
- Average active listings per 10k homes: 166.1
- Average monthly active listings: 2,132
- Median sale price: $196,714
- Median age of population: 32.9
 Photo Credit: f11photo / Shutterstock
13. San Francisco, CA
- Average months of supply: 1.8
- Average active listings per 10k homes: 134.3
- Average monthly active listings: 1,825
- Median sale price: $1,423,143
- Median age of population: 38.2
 Photo Credit: Sean Pavone / Shutterstock
12. Dallas, TX
- Average months of supply: 1.8
- Average active listings per 10k homes: 181.5
- Average monthly active listings: 3,827
- Median sale price: $393,714
- Median age of population: 32.9
 Photo Credit: Sean Pavone / Shutterstock
11. Atlanta, GA
- Average months of supply: 1.9
- Average active listings per 10k homes: 437.9
- Average monthly active listings: 4,568
- Median sale price: $365,857
- Median age of population: 33.3
 Photo Credit: Sean Pavone / Shutterstock
10. Philadelphia, PA
- Average months of supply: 2.0
- Average active listings per 10k homes: 175.1
- Average monthly active listings: 5,667
- Median sale price: $262,143
- Median age of population: 34.7
 Photo Credit: Sean Pavone / Shutterstock
9. Houston, TX
- Average months of supply: 2.2
- Average active listings per 10k homes: 302.4
- Average monthly active listings: 10,691
- Median sale price: $281,143
- Median age of population: 33.4
 Photo Credit: Sean Pavone / Shutterstock
8. Boston, MA
- Average months of supply: 2.4
- Average active listings per 10k homes: 246.5
- Average monthly active listings: 2,322
- Median sale price: $725,429
- Median age of population: 32.6
 Photo Credit: Sean Pavone / Shutterstock
7. Los Angeles, CA
- Average months of supply: 2.4
- Average active listings per 10k homes: 184.8
- Average monthly active listings: 9,447
- Median sale price: $891,143
- Median age of population: 35.9
 Photo Credit: Sean Pavone / Shutterstock
6. Cleveland, OH
- Average months of supply: 2.4
- Average active listings per 10k homes: 218.6
- Average monthly active listings: 1,502
- Median sale price: $112,429
- Median age of population: 35.5
 Photo Credit: Sean Pavone / Shutterstock
5. Milwaukee, WI
- Average months of supply: 2.5
- Average active listings per 10k homes: 238.0
- Average monthly active listings: 2,213
- Median sale price: $170,571
- Median age of population: 31.5
 Photo Credit: f11photo / Shutterstock
4. New Orleans, LA
- Average months of supply: 2.5
- Average active listings per 10k homes: 247.9
- Average monthly active listings: 1,865
- Median sale price: $329,857
- Median age of population: 38.3
 Photo Credit: Oleg Podzorov / Shutterstock
3. Chicago, IL
- Average months of supply: 2.8
- Average active listings per 10k homes: 271.3
- Average monthly active listings: 12,941
- Median sale price: $343,857
- Median age of population: 35.2
 Photo Credit: Sean Pavone / Shutterstock
2. Detroit, MI
- Average months of supply: 3.1
- Average active listings per 10k homes: 146.7
- Average monthly active listings: 1,875
- Median sale price: $68,143
- Median age of population: 35.0
 Photo Credit: Sean Pavone / Shutterstock
1. New York, NY
- Average months of supply: 4.8
- Average active listings per 10k homes: 206.0
- Average monthly active listings: 21,066
- Median sale price: $765,571
- Median age of population: 37.2
Detailed Findings & Methodology
The data used in this analysis is from Redfin's Data Center, and the U.S. Census Bureau's 2019 American Community Survey. To determine the young cities with the most homes for sale, researchers only considered cities with median ages below the national median of 38.5 years. To rank these cities, researchers calculated the average months of supply for the year 2021 with all data available at the time, which covered the months of January through July. In the event of a tie, the city with more active listings per owner-occupied housing unit was ranked higher. To improve relevance, only cities with at least 100,000 residents were included. Additionally, cities were grouped into cohorts based on population size: small (100,000–149,999), midsize (150,000–349,999), and large (350,000 or more).