
Nov 4, 2025
Moving is hard — finding trustworthy advice shouldn't be. For nearly two decades, HireAHelper has helped people complete over a million moves, and we've turned everything we've learned into the practical guides, checklists, and expert tips you'll find here. Whether you're moving across town or across the country, packing a single room or a whole house, our advice breaks every step down so you can move with less stress and more confidence.
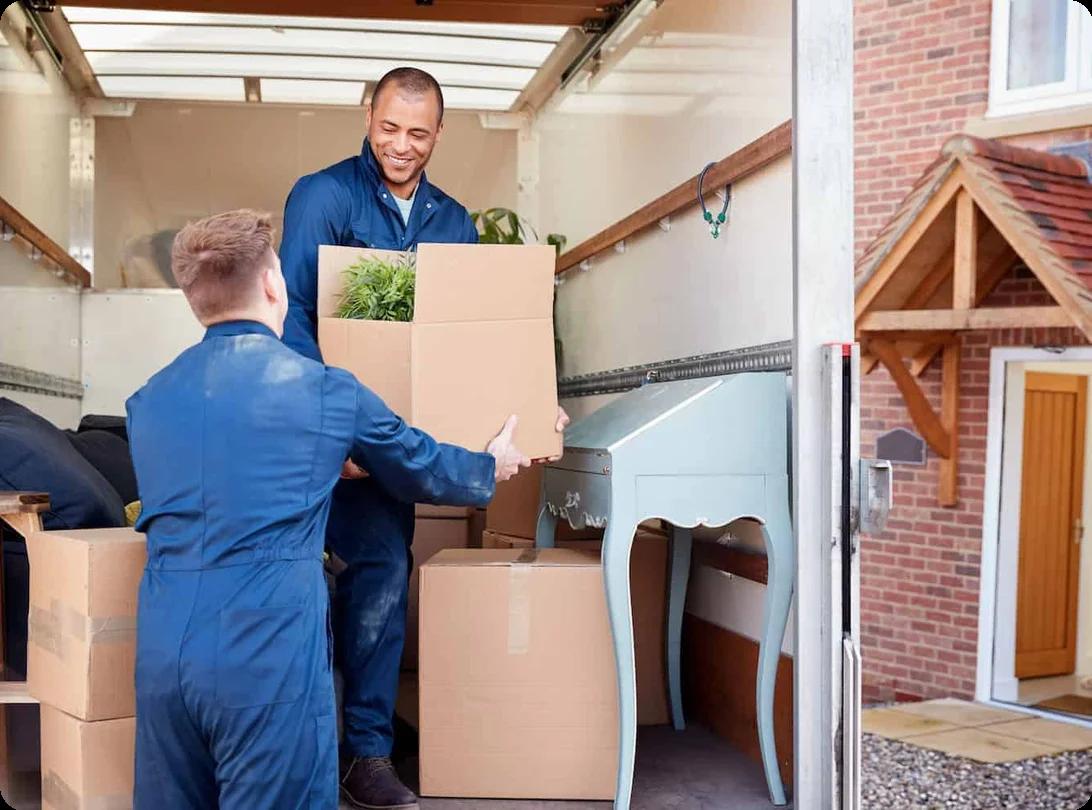
HireAHelper makes booking trusted moving help simple. Compare licensed, background-checked movers near you using real customer reviews and upfront pricing, then book the right crew — for loading, unloading, packing, or your entire move — in just a few minutes.
Nov 4, 2025
Choosing a moving company can feel confusing and opaque when you’re trying to avoid hidden fees, damaged items, or a no-show on moving day, but every mover claims they’re reliable. The safest place to start is with... Read More
Renting a U-Haul is usually straightforward, but the final cost depends on more than handing over your card and driving off with a truck. In short, U-Haul usually does not ask for a deposit if you pay with a major... Read More
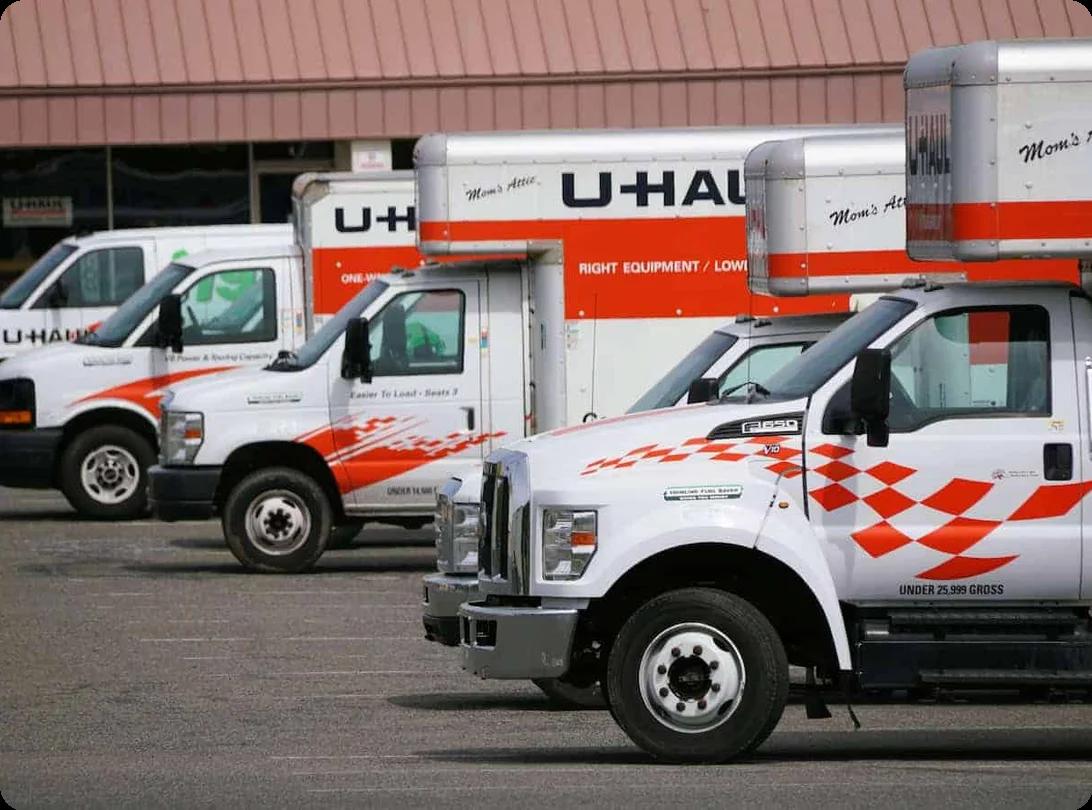
The best U-Haul alternative depends on what kind of move you’re doing. For a long-distance move, Penske is a great first place to check because the trucks are known for being comfortable on longer drives, and most... Read More
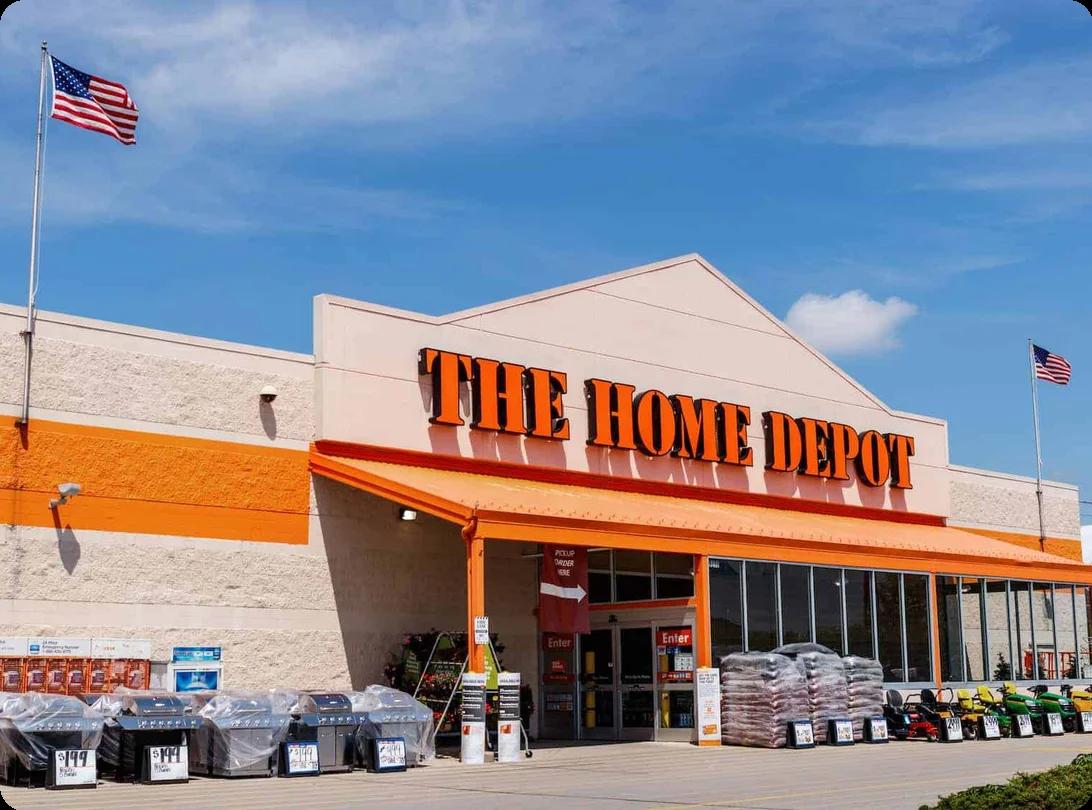
Choosing between Home Depot and U-Haul for your moving truck depends on the kind of move you’re making. U-Haul is usually the better choice for most local moves, especially if you need more truck sizes, a one-way... Read More
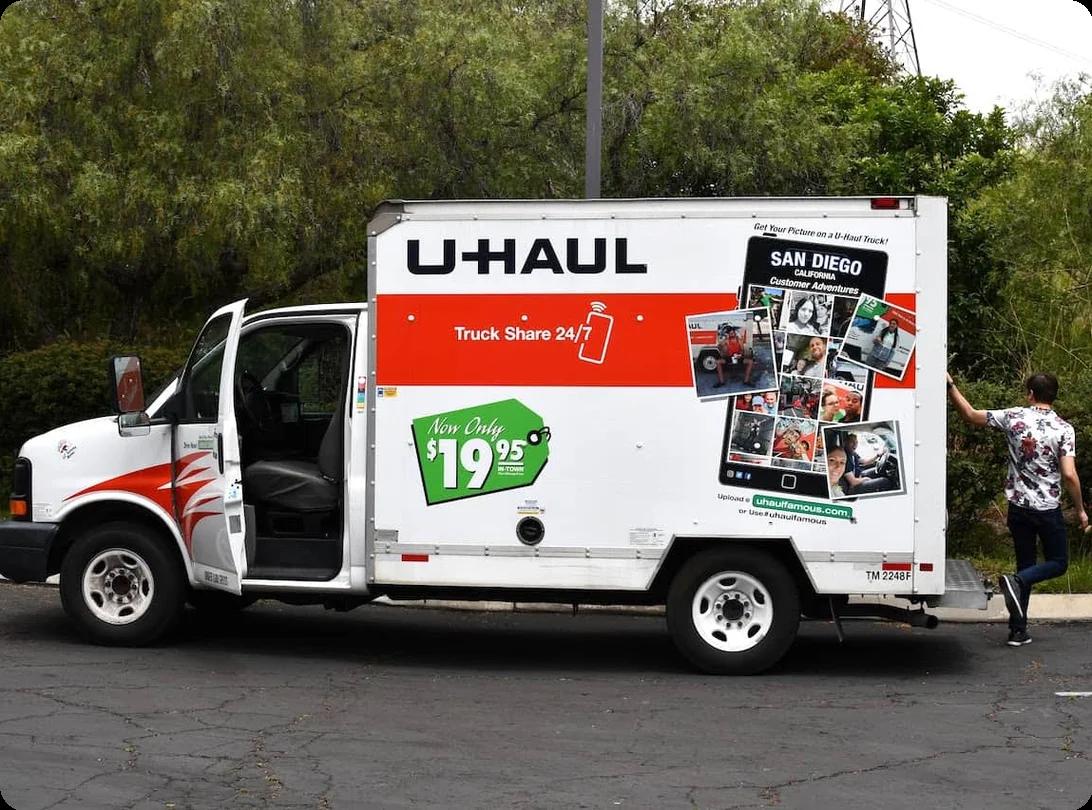
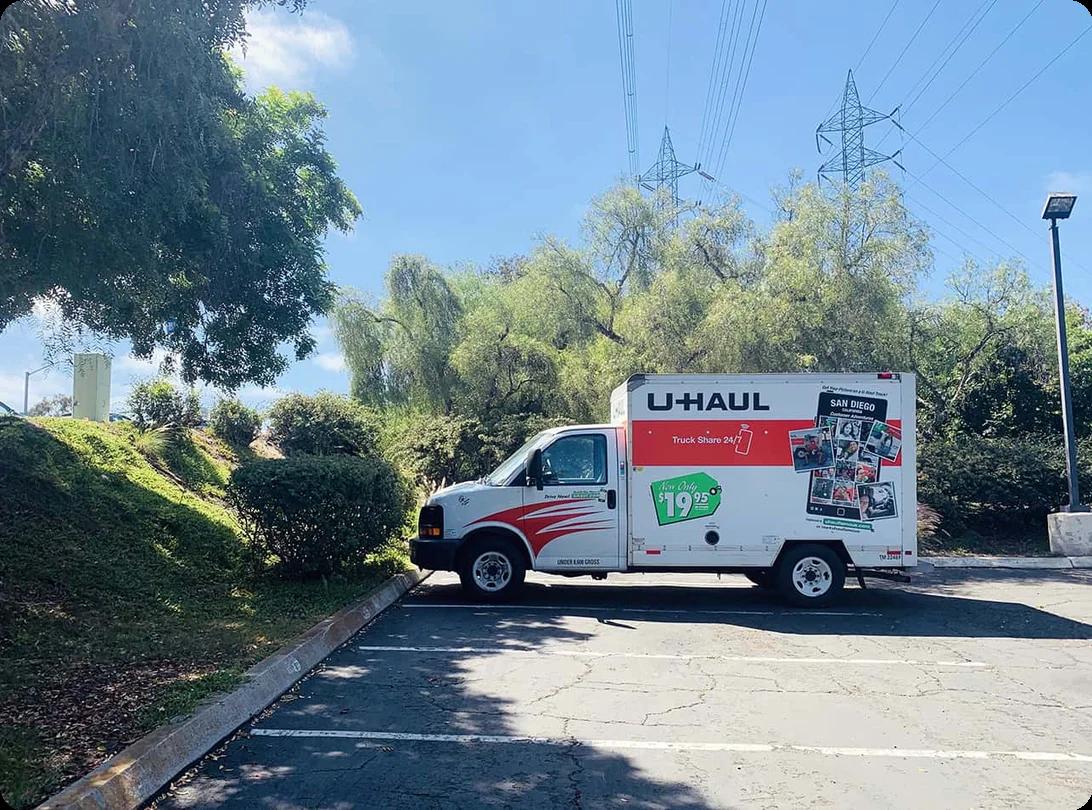
U-Haul truck rentals start at $19.95 a day, but that’s just the advertised rate and does not include the full cost of getting your belongings from one home to another. Your real total depends on the truck size,... Read More

Many people don't realize that they may need new health insurance when moving to another state, and this crucial task is easy to overlook when you're juggling packing, housing, and managing movers. Whether you need... Read More

Waterfront living is a dream for a lot of people, but floating homes take that idea one step further: They let you live on the water. A floating home is a stationary house built on a buoyant foundation, permanently... Read More

Packing an art studio can feel more complicated than packing the rest of the house. Instead of neatly shaped household items, you may be dealing with paints, delicate brushes, unfinished work, fragile ceramics, and... Read More
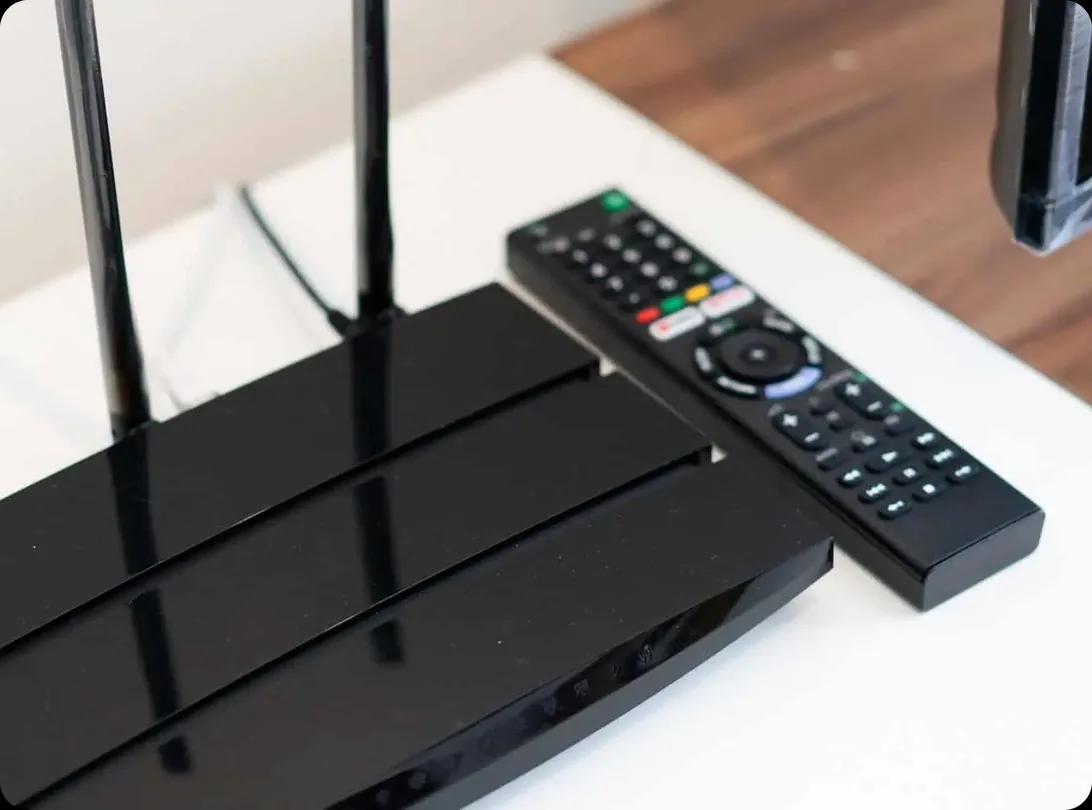
To transfer internet service when you move, first check whether your provider serves your new address, then schedule setup and keep the old service active until the new connection is working. The main thing to... Read More
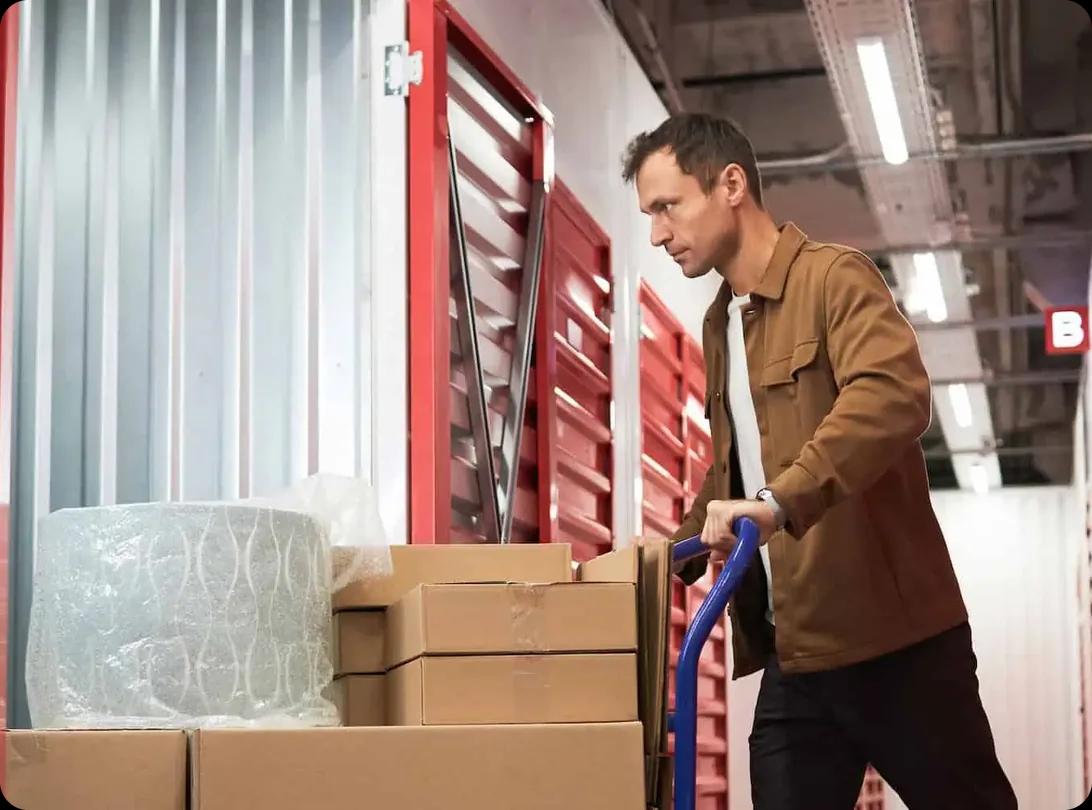
Self-storage has become a regular part of American life, with 8.2% of Americans renting a storage unit in the past year. For consumers, that growth shows how closely storage is tied to housing and household change.... Read More

Loving a city after visiting is one thing, but figuring out whether you would enjoy living there permanently is much harder. That’s where a trial run comes in: it gives you time to experience the parts of life that... Read More
Yes, AAA members can get discounts on moving truck rentals — often as high as 12% — when booking through select partner brands such as Penske or Budget. These deals are designed to give members added value through... Read More

Moving solar panels to a new house is possible, but taking them off one roof and installing them on another is a complicated and expensive project. In most cases, you will need a solar installer to remove the... Read More

Choosing a storage unit can get confusing once you start comparing indoor and outdoor units, drive-up spaces, climate control, lockers, and specialty storage. The right option usually depends on what you are... Read More

Unpacking can take anywhere from a few days to several weeks. Without a strategy, it's easy to lose motivation or end up living among half-emptied boxes and chaos for months. The best way to unpack after moving is... Read More

Moving in together is exciting, but it works best when you talk through the practical stuff before the boxes come out. Before you sign a lease or merge households, you’ll need to discuss money, chores, boundaries,... Read More

Figuring out how to navigate a steep flight of stairs with a heavy couch or dresser can quickly become the most stressful part of your move. To carry these items down stairs safely, you need to measure your... Read More

Professional packing can take anywhere from 2 hours for a small apartment to a full day or more for a larger home. The actual timeline depends on how much you own and how prepared you are when the crew arrives. In... Read More
Packers do not always bring their own boxes, including when you book labor-only packing help directly or through HireAHelper. What supplies they bring depends on the type of packing service you choose. With... Read More

Choosing between a moving broker and a carrier comes down to how much control you want over your move. A carrier is usually the better choice if you want to work directly with the company handling your belongings.... Read More